Silver Price Forecast: XAG/USD faces pressure around $34, Trump tariffs remain key
- Silver trades with caution around $34.00 with investors focusing on the release of reciprocal tariffs by US President Trump on Wednesday.
- Trump’s tariffs are expected to shrink economic growth across the globe.
- The USD Index edges higher ahead of the US ISM Manufacturing PMI and the JOLTS Job Openings data.

Silver price (XAG/USD) trades cautiously around $34.00 in Tuesday’s North American session. The white metal continues to face selling pressure above $34.00 since Friday as investors seek clarity over the level of tariffs to be announced by United States (US) President Donald Trump on Wednesday, or so-called “Liberation Day”.
According to the Washington Post, the White House aides have drafted a proposal to impose 20% tariffs on most imports to the US.
The imposition of significant levies by US President Trump is seen as resulting in significant economic shocks across the globe. Such a scenario bodes well for safe-haven assets, such as Silver.
Investors expect that Trump's tariffs will also impact the US economy, given that the burden of higher import duties will be borne by domestic importers. This has escalated risks of a resurgence in inflationary pressures in the near term. Fears of an acceleration in price pressures have led Federal Reserve (Fed) officials to continue maintaining a restrictive monetary policy stance for a longer period.
Meanwhile, investors await the US ISM Manufacturing Purchasing Managers’ Index (PMI) data for March and the JOLTS Job Openings data for February, which will be published at 14:00 GMT. Economists expect the Manufacturing PMI to have declined to 49.5 from 50.3 in February. US employers are estimated to have posted 7.63 million jobs in February, slightly lower than the prior release of 7.74 million.
Ahead of the US economic data, the US Dollar Index (DXY), which tracks the Greenback’s value against six major currencies, trades slightly higher to near 104.30.
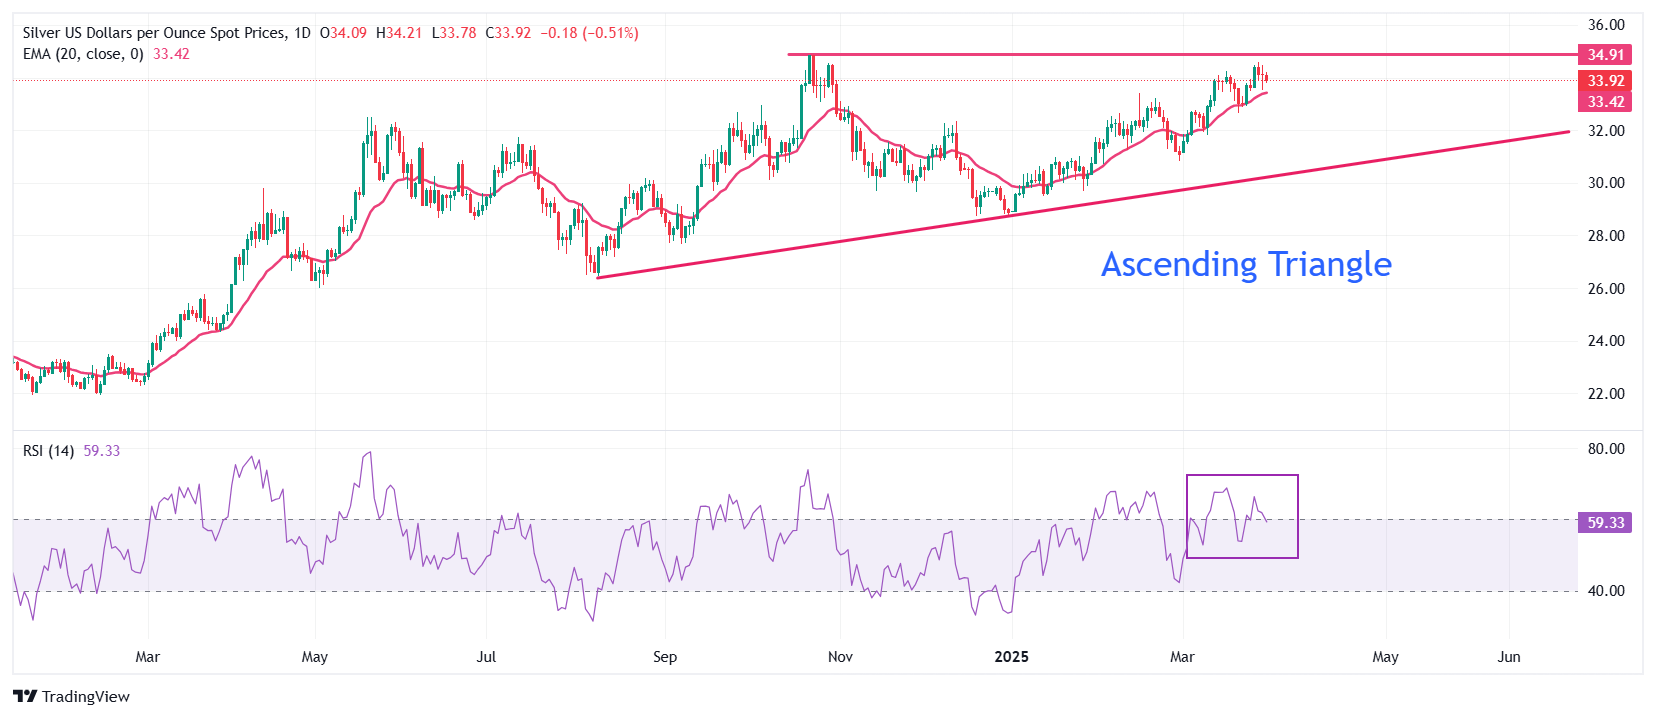
Silver technical analysis
Silver price struggles to advance its upside move towards the flat border of the Ascending Triangle chart pattern formation on the daily timeframe near the October 22 high of $34.87. The upward-sloping border of the above-mentioned chart pattern is placed from the August 8 low of $26.45. Technically, the Ascending Triangle pattern indicates indecisiveness among market participants.
The 20-day Exponential Moving Average (EMA) near $33.40 continues to provide support to the Silver price.
The 14-day Relative Strength Index (RSI) rebounds above 60.00, suggesting a resurgence in bullish momentum.
Looking down, the March 6 high of $32.77 will act as key support for the Silver price. While, the October 22 high of $34.87 will be the major barrier.
Silver daily chart
Silver FAQs
Silver is a precious metal highly traded among investors. It has been historically used as a store of value and a medium of exchange. Although less popular than Gold, traders may turn to Silver to diversify their investment portfolio, for its intrinsic value or as a potential hedge during high-inflation periods. Investors can buy physical Silver, in coins or in bars, or trade it through vehicles such as Exchange Traded Funds, which track its price on international markets.
Silver prices can move due to a wide range of factors. Geopolitical instability or fears of a deep recession can make Silver price escalate due to its safe-haven status, although to a lesser extent than Gold's. As a yieldless asset, Silver tends to rise with lower interest rates. Its moves also depend on how the US Dollar (USD) behaves as the asset is priced in dollars (XAG/USD). A strong Dollar tends to keep the price of Silver at bay, whereas a weaker Dollar is likely to propel prices up. Other factors such as investment demand, mining supply – Silver is much more abundant than Gold – and recycling rates can also affect prices.
Silver is widely used in industry, particularly in sectors such as electronics or solar energy, as it has one of the highest electric conductivity of all metals – more than Copper and Gold. A surge in demand can increase prices, while a decline tends to lower them. Dynamics in the US, Chinese and Indian economies can also contribute to price swings: for the US and particularly China, their big industrial sectors use Silver in various processes; in India, consumers’ demand for the precious metal for jewellery also plays a key role in setting prices.
Silver prices tend to follow Gold's moves. When Gold prices rise, Silver typically follows suit, as their status as safe-haven assets is similar. The Gold/Silver ratio, which shows the number of ounces of Silver needed to equal the value of one ounce of Gold, may help to determine the relative valuation between both metals. Some investors may consider a high ratio as an indicator that Silver is undervalued, or Gold is overvalued. On the contrary, a low ratio might suggest that Gold is undervalued relative to Silver.
Author

Sagar Dua
FXStreet
Sagar Dua is associated with the financial markets from his college days. Along with pursuing post-graduation in Commerce in 2014, he started his markets training with chart analysis.


