Silver Price Forecast: XAG/USD dives to over one-week low, further below $36.00
- Silver attracts heavy sellers for the third straight day and seems vulnerable to slide further.
- An intraday breakdown below the 23.6% Fibo. level could be seen as a key trigger for bears.
- Some follow-through selling below 100- SMA on H4 should pave the way for deeper losses.

Silver (XA/USD) is seen prolonging its retracement slide from the highest level since February 2012 touched earlier this week and losing ground for the third consecutive day on Friday. The downward trajectory drags the white metal to over a one-week low, around the $35.65 area during the Asian session.
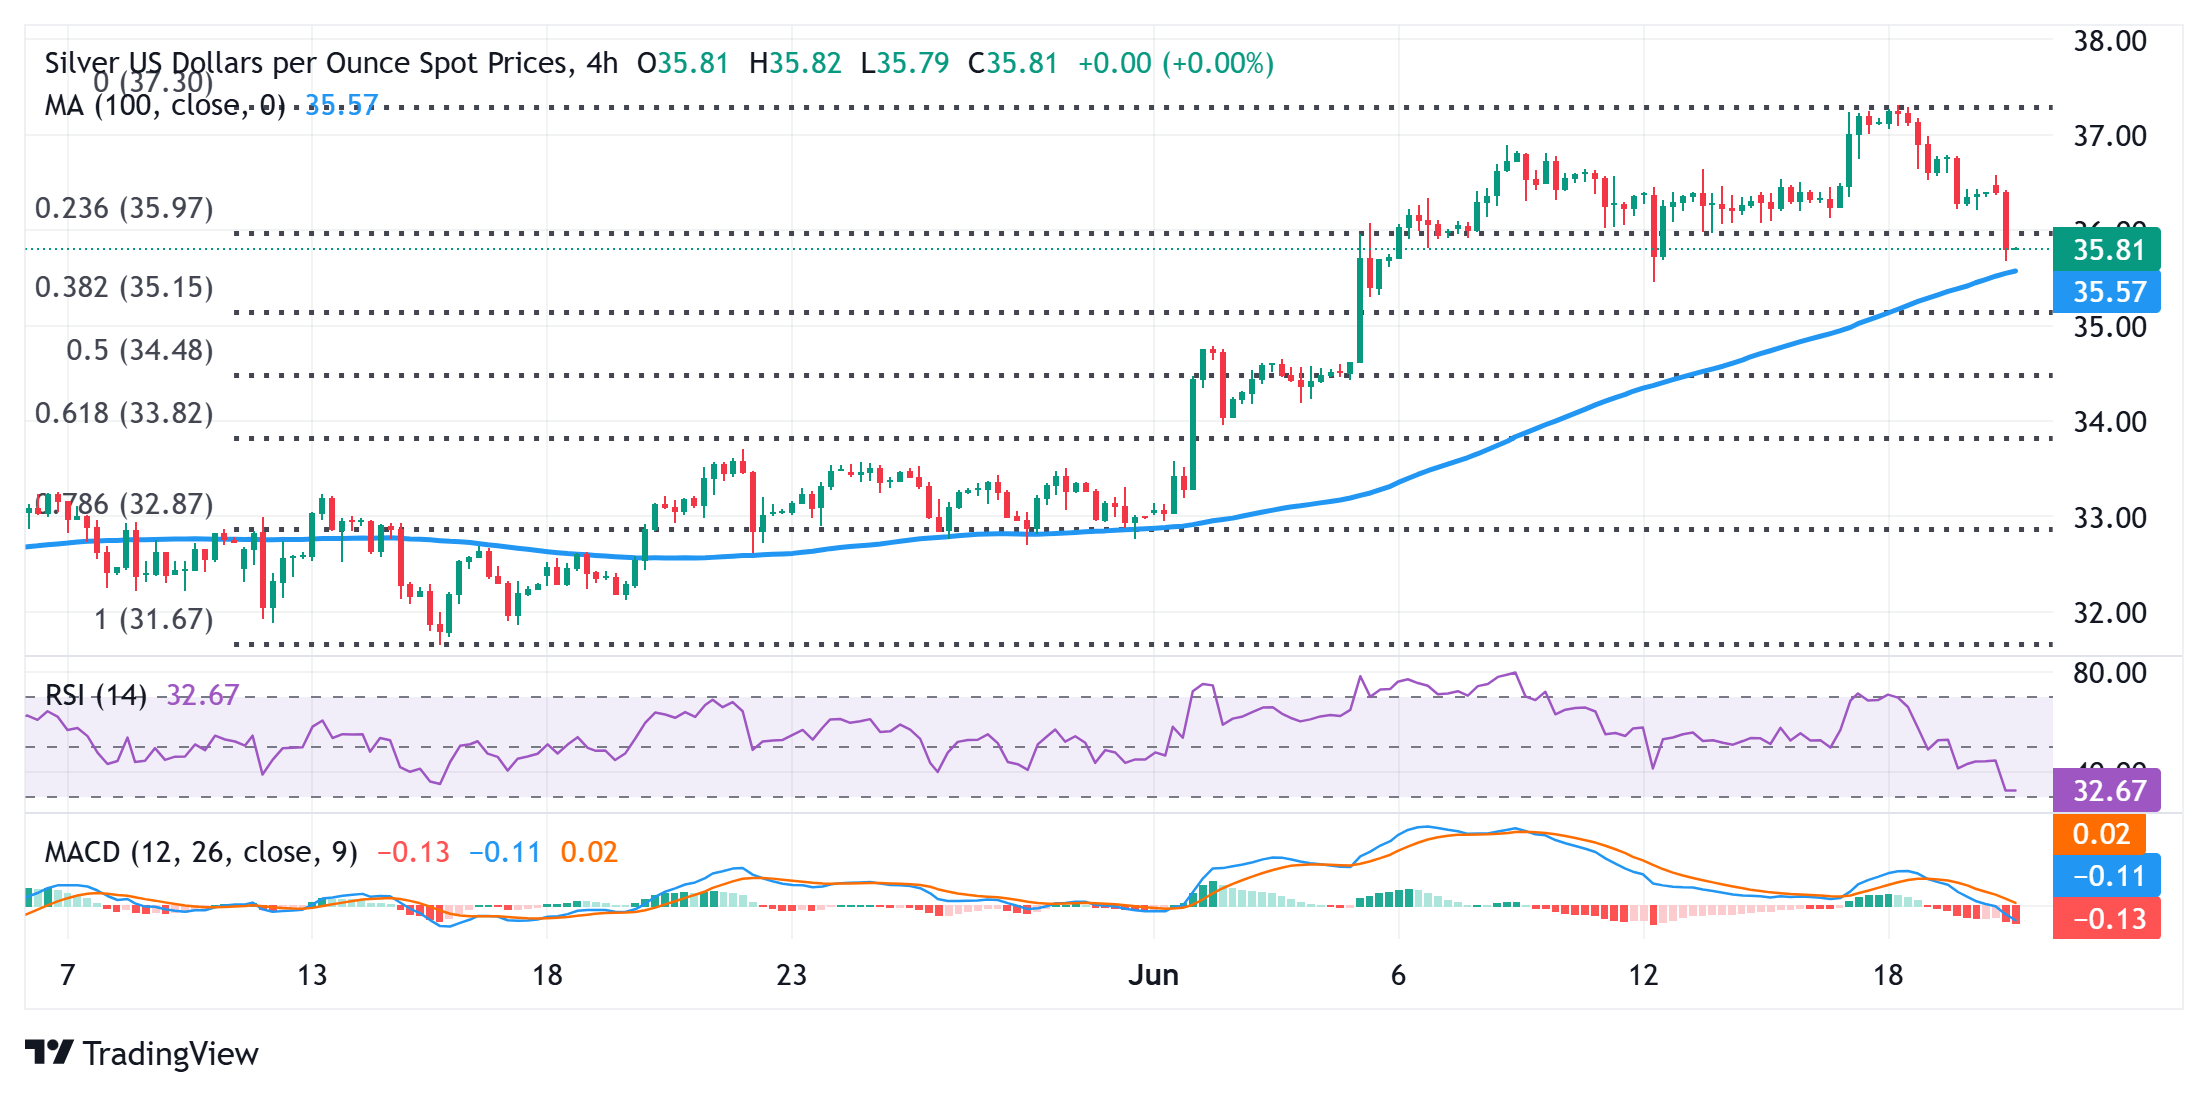
From a technical perspective, the XAG/USD's failure to build on this week's move beyond the $37.00 mark and the subsequent decline below the 23.6% Fibonacci retracement level of the May-June rally favor bearish traders. Moreover, oscillators on the 4-hour chart have been gaining negative traction and back the case for a further depreciating move. That said, it will still be prudent to wait for some follow-through selling below the mid-$35.00s, or the 100-period Simple Moving Average (SMA) on the 4-hour chart, before positioning for deeper losses.
The XAG/USD might then accelerate the corrective slide towards the 38.2% Fibo. level, around the $35.15 region, en route to the $35.00 psychological mark. The downward trajectory could extend further toward the $34.75 intermediate support before the commodity eventually drops to the $34.45 area or the 50% retracement level. The latter should act as a key pivotal point, which if broken decisively will suggest that the white metal has topped out and pave the way for some meaningful depreciating move in the near term.
On the flip side, any attempted recovery back above the $36.00 mark, coinciding with the 23.6% Fibo. level, could attract fresh sellers and remain capped near the $36.40-$36.50 supply zone. A sustained strength beyond the said barrier, however, might shift the bias back in favor of bullish traders and lift the XAG/USD back towards the $37.00 round figure en route to the multi-year high, around the $37.30-$37.35 area touched on Wednesday.
Silver 4-hour chart
Silver FAQs
Silver is a precious metal highly traded among investors. It has been historically used as a store of value and a medium of exchange. Although less popular than Gold, traders may turn to Silver to diversify their investment portfolio, for its intrinsic value or as a potential hedge during high-inflation periods. Investors can buy physical Silver, in coins or in bars, or trade it through vehicles such as Exchange Traded Funds, which track its price on international markets.
Silver prices can move due to a wide range of factors. Geopolitical instability or fears of a deep recession can make Silver price escalate due to its safe-haven status, although to a lesser extent than Gold's. As a yieldless asset, Silver tends to rise with lower interest rates. Its moves also depend on how the US Dollar (USD) behaves as the asset is priced in dollars (XAG/USD). A strong Dollar tends to keep the price of Silver at bay, whereas a weaker Dollar is likely to propel prices up. Other factors such as investment demand, mining supply – Silver is much more abundant than Gold – and recycling rates can also affect prices.
Silver is widely used in industry, particularly in sectors such as electronics or solar energy, as it has one of the highest electric conductivity of all metals – more than Copper and Gold. A surge in demand can increase prices, while a decline tends to lower them. Dynamics in the US, Chinese and Indian economies can also contribute to price swings: for the US and particularly China, their big industrial sectors use Silver in various processes; in India, consumers’ demand for the precious metal for jewellery also plays a key role in setting prices.
Silver prices tend to follow Gold's moves. When Gold prices rise, Silver typically follows suit, as their status as safe-haven assets is similar. The Gold/Silver ratio, which shows the number of ounces of Silver needed to equal the value of one ounce of Gold, may help to determine the relative valuation between both metals. Some investors may consider a high ratio as an indicator that Silver is undervalued, or Gold is overvalued. On the contrary, a low ratio might suggest that Gold is undervalued relative to Silver.
Author

Haresh Menghani
FXStreet
Haresh Menghani is a detail-oriented professional with 10+ years of extensive experience in analysing the global financial markets.


