Silver Price Forecast: XAG/USD corrects to near $32.40 as Trump reprieves tariffs on automobiles
- Silver price falls to near $32.40 as US President Trump relaxes tariffs on automobiles from Canada and Mexico for a month.
- Higher US bond yields have contributed to some correction in the Silver price.
- Investors await the US NFP data, which will influence the Fed’s monetary policy outlook.

Silver Price (XAG/USD) corrects from the weekly high of $32.70 and drops to near $32.40 in North American trading hours on Thursday. The white metal drops as fears of an intense global trade war have eased as the White House confirmed that United States (US) President Donald Trump will provide a one-month relaxation of tariffs on automobiles imported from Canada and Mexico.
On Tuesday, proposed 25% tariffs on Canada and Mexico from President Donald Trump went into effect.
"We spoke with the big three auto dealers and are going to give a one-month exemption on any autos coming through USMCA, Leavitt said and added, “Trump is open to hearing about additional tariff exemptions.”
Historically, heightened geopolitical tensions improve the appeal of precious metals, such as Silver.
Meanwhile, an increase in US bond yields after surprisingly upbeat US ISM Services PMI data for February has also weighed on the Silver price. 10-year US Treasury yields gain to near 4.29%. Higher yields on interest-bearing assets increase the opportunity cost of holding investments in non-yielding assets, such as Silver.
Going forward, investors will focus on the US Nonfarm Payrolls (NFP) data for February, which will be released on Friday. The official employment data will influence market speculation for the Federal Reserve’s (Fed) monetary policy outlook.
Silver technical analysis
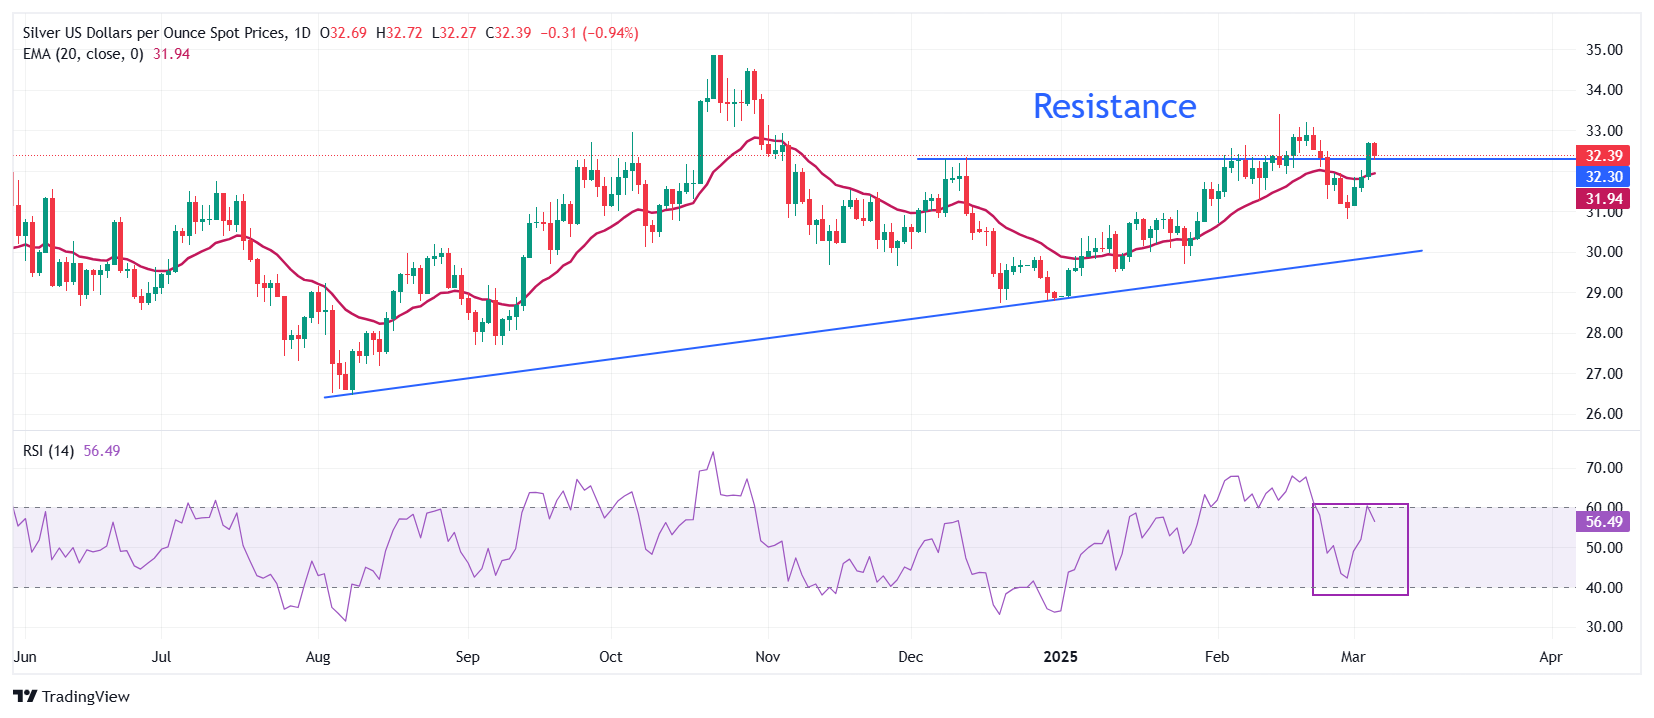
Silver price strives to hold the key resistance of $32.40 plotted from the December 12 high. The asset trades above the 20-day Exponential Moving Average (EMA), which trades around $31.85, suggesting that the near-term trend is bullish.
The 14-day Relative Strength Index (RSI) oscillates inside the 40.00-60.00 range, suggesting a sideways trend.
Looking down, the upward-sloping trendline from the August 8 low of $26.45 will act as key support for the Silver price around $30.00. While, the February 14 high of $33.40 will be the key barrier.
Silver daily chart
Silver FAQs
Silver is a precious metal highly traded among investors. It has been historically used as a store of value and a medium of exchange. Although less popular than Gold, traders may turn to Silver to diversify their investment portfolio, for its intrinsic value or as a potential hedge during high-inflation periods. Investors can buy physical Silver, in coins or in bars, or trade it through vehicles such as Exchange Traded Funds, which track its price on international markets.
Silver prices can move due to a wide range of factors. Geopolitical instability or fears of a deep recession can make Silver price escalate due to its safe-haven status, although to a lesser extent than Gold's. As a yieldless asset, Silver tends to rise with lower interest rates. Its moves also depend on how the US Dollar (USD) behaves as the asset is priced in dollars (XAG/USD). A strong Dollar tends to keep the price of Silver at bay, whereas a weaker Dollar is likely to propel prices up. Other factors such as investment demand, mining supply – Silver is much more abundant than Gold – and recycling rates can also affect prices.
Silver is widely used in industry, particularly in sectors such as electronics or solar energy, as it has one of the highest electric conductivity of all metals – more than Copper and Gold. A surge in demand can increase prices, while a decline tends to lower them. Dynamics in the US, Chinese and Indian economies can also contribute to price swings: for the US and particularly China, their big industrial sectors use Silver in various processes; in India, consumers’ demand for the precious metal for jewellery also plays a key role in setting prices.
Silver prices tend to follow Gold's moves. When Gold prices rise, Silver typically follows suit, as their status as safe-haven assets is similar. The Gold/Silver ratio, which shows the number of ounces of Silver needed to equal the value of one ounce of Gold, may help to determine the relative valuation between both metals. Some investors may consider a high ratio as an indicator that Silver is undervalued, or Gold is overvalued. On the contrary, a low ratio might suggest that Gold is undervalued relative to Silver.
Author

Sagar Dua
FXStreet
Sagar Dua is associated with the financial markets from his college days. Along with pursuing post-graduation in Commerce in 2014, he started his markets training with chart analysis.


