Silver Price Forecast: XAG/USD clings to gains below $34 on Trump tariff woes
- Silver price grips gains as uncertainty over the global economic outlook due to the Trump-led trade war.
- US individuals are cautious over economic prospects under Trump’s leadership.
- Investors await the US PCE inflation for a fresh Fed monetary policy outlook.

Silver price (XAG/USD) holds onto gains near $33.80 in European trading hours on Wednesday. The white metal shows resilience as market participants are cautious over the United States (US) economic outlook under the leadership of President Donald Trump.
Fears of imposition of potential tariffs by Donald Trump on April 2 have dented the confidence of households in the economy. The US Conference Board reported on Tuesday that the Consumer Confidence, a leading indicator of individuals’ confidence in economic prospects, declined to 92.9, significantly lower than 100.1 seen in February. The scenario of heightened economic uncertainty often leads to an increase in the safe-haven demand of non-yielding assets, such as Silver.
However, Trump has teased that not all impending tariffs will come into effect on April 2 as he may give a "lot of countries" breaks on tariffs.
Meanwhile, the US Dollar Index (DXY), which tracks the Greenback’s value against six major currencies, trades sideways around the three-week high of 104.50. The US Dollar is expected to trade cautiously as investors expect Trump’s economic policies could result in an economic slowdown and a resurgence in inflationary pressures in the US economy.
This week, the major trigger for the US Dollar will be the US Personal Consumption Expenditure Price Index (PCE) data for February, which will be released on Friday. The inflation data will influence market expectations for the Federal Reserve’s (Fed) monetary policy outlook. The Silver price carries an inverse relationship with the degree of US interest rates.
Silver technical analysis
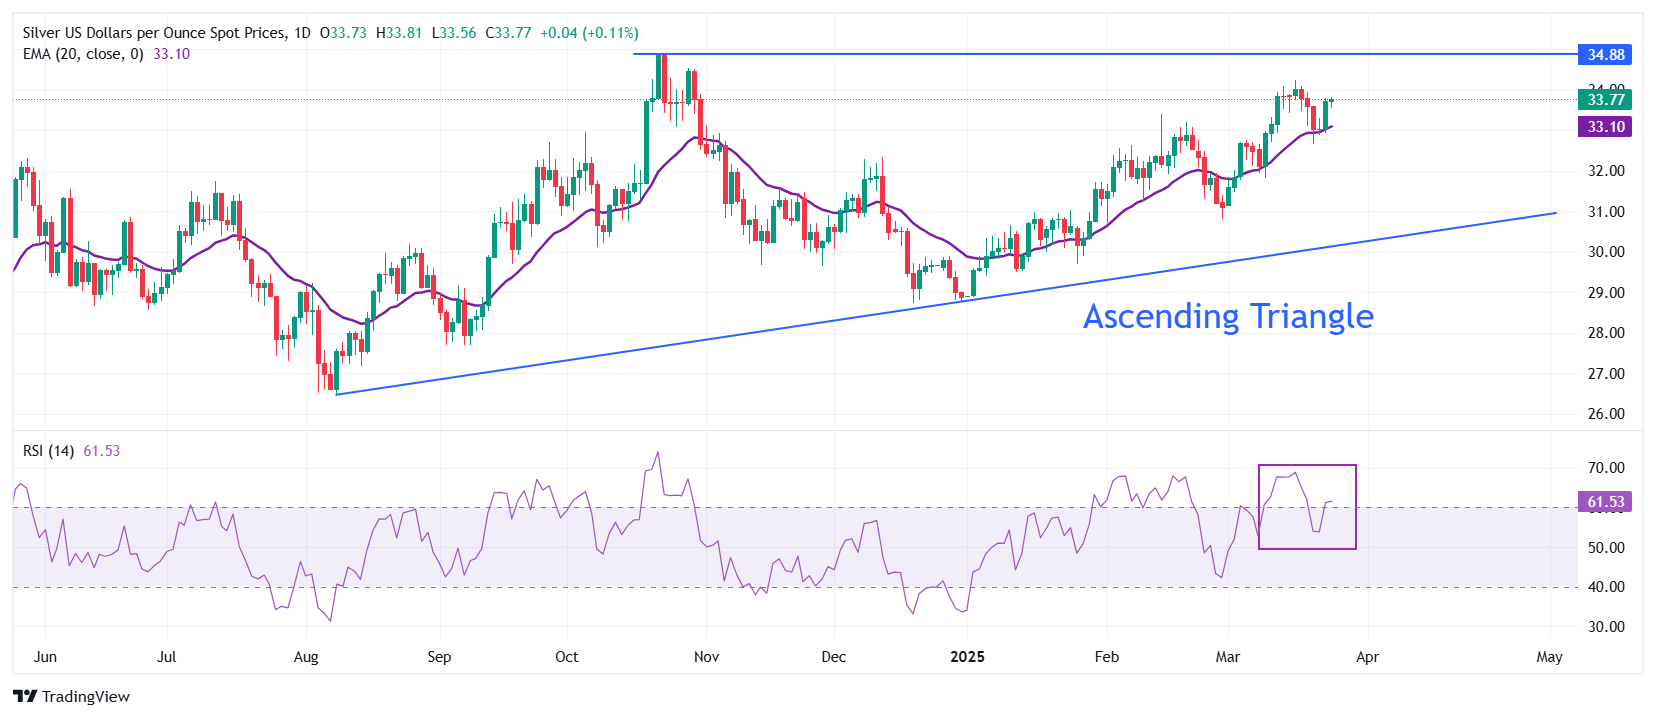
Silver price strives to revisit the flat border of the Ascending Triangle chart pattern formation on the daily timeframe near the October 22 high of $34.87. The upward-sloping border of the above-mentioned chart pattern is placed from the August 8 low of $26.45. Technically, the Ascending Triangle pattern indicates indecisiveness among market participants.
The 20-day Exponential Moving Average (EMA) near $33.10 continues to provide support to the Silver price.
The 14-day Relative Strength Index (RSI) rebounds above 60.00, suggesting a resurgence in bullish momentum.
Looking down, the March 6 high of $32.77 will act as key support for the Silver price. While, the October 22 high of $34.87 will be the major barrier.
Silver daily chart
Silver FAQs
Silver is a precious metal highly traded among investors. It has been historically used as a store of value and a medium of exchange. Although less popular than Gold, traders may turn to Silver to diversify their investment portfolio, for its intrinsic value or as a potential hedge during high-inflation periods. Investors can buy physical Silver, in coins or in bars, or trade it through vehicles such as Exchange Traded Funds, which track its price on international markets.
Silver prices can move due to a wide range of factors. Geopolitical instability or fears of a deep recession can make Silver price escalate due to its safe-haven status, although to a lesser extent than Gold's. As a yieldless asset, Silver tends to rise with lower interest rates. Its moves also depend on how the US Dollar (USD) behaves as the asset is priced in dollars (XAG/USD). A strong Dollar tends to keep the price of Silver at bay, whereas a weaker Dollar is likely to propel prices up. Other factors such as investment demand, mining supply – Silver is much more abundant than Gold – and recycling rates can also affect prices.
Silver is widely used in industry, particularly in sectors such as electronics or solar energy, as it has one of the highest electric conductivity of all metals – more than Copper and Gold. A surge in demand can increase prices, while a decline tends to lower them. Dynamics in the US, Chinese and Indian economies can also contribute to price swings: for the US and particularly China, their big industrial sectors use Silver in various processes; in India, consumers’ demand for the precious metal for jewellery also plays a key role in setting prices.
Silver prices tend to follow Gold's moves. When Gold prices rise, Silver typically follows suit, as their status as safe-haven assets is similar. The Gold/Silver ratio, which shows the number of ounces of Silver needed to equal the value of one ounce of Gold, may help to determine the relative valuation between both metals. Some investors may consider a high ratio as an indicator that Silver is undervalued, or Gold is overvalued. On the contrary, a low ratio might suggest that Gold is undervalued relative to Silver.
Author

Sagar Dua
FXStreet
Sagar Dua is associated with the financial markets from his college days. Along with pursuing post-graduation in Commerce in 2014, he started his markets training with chart analysis.


