Silver Price Forecast: XAG/USD bulls have the upper hand while above $49.35 pivotal support
- Silver attracts some dip-buying following a modest Asian session dip to sub-$50.00 levels.
- Neutral oscillators on 4-hour/daily charts warrant caution before placing directional bets.
- A convincing break below the $49.35 pivotal support would pave the way for deeper losses.

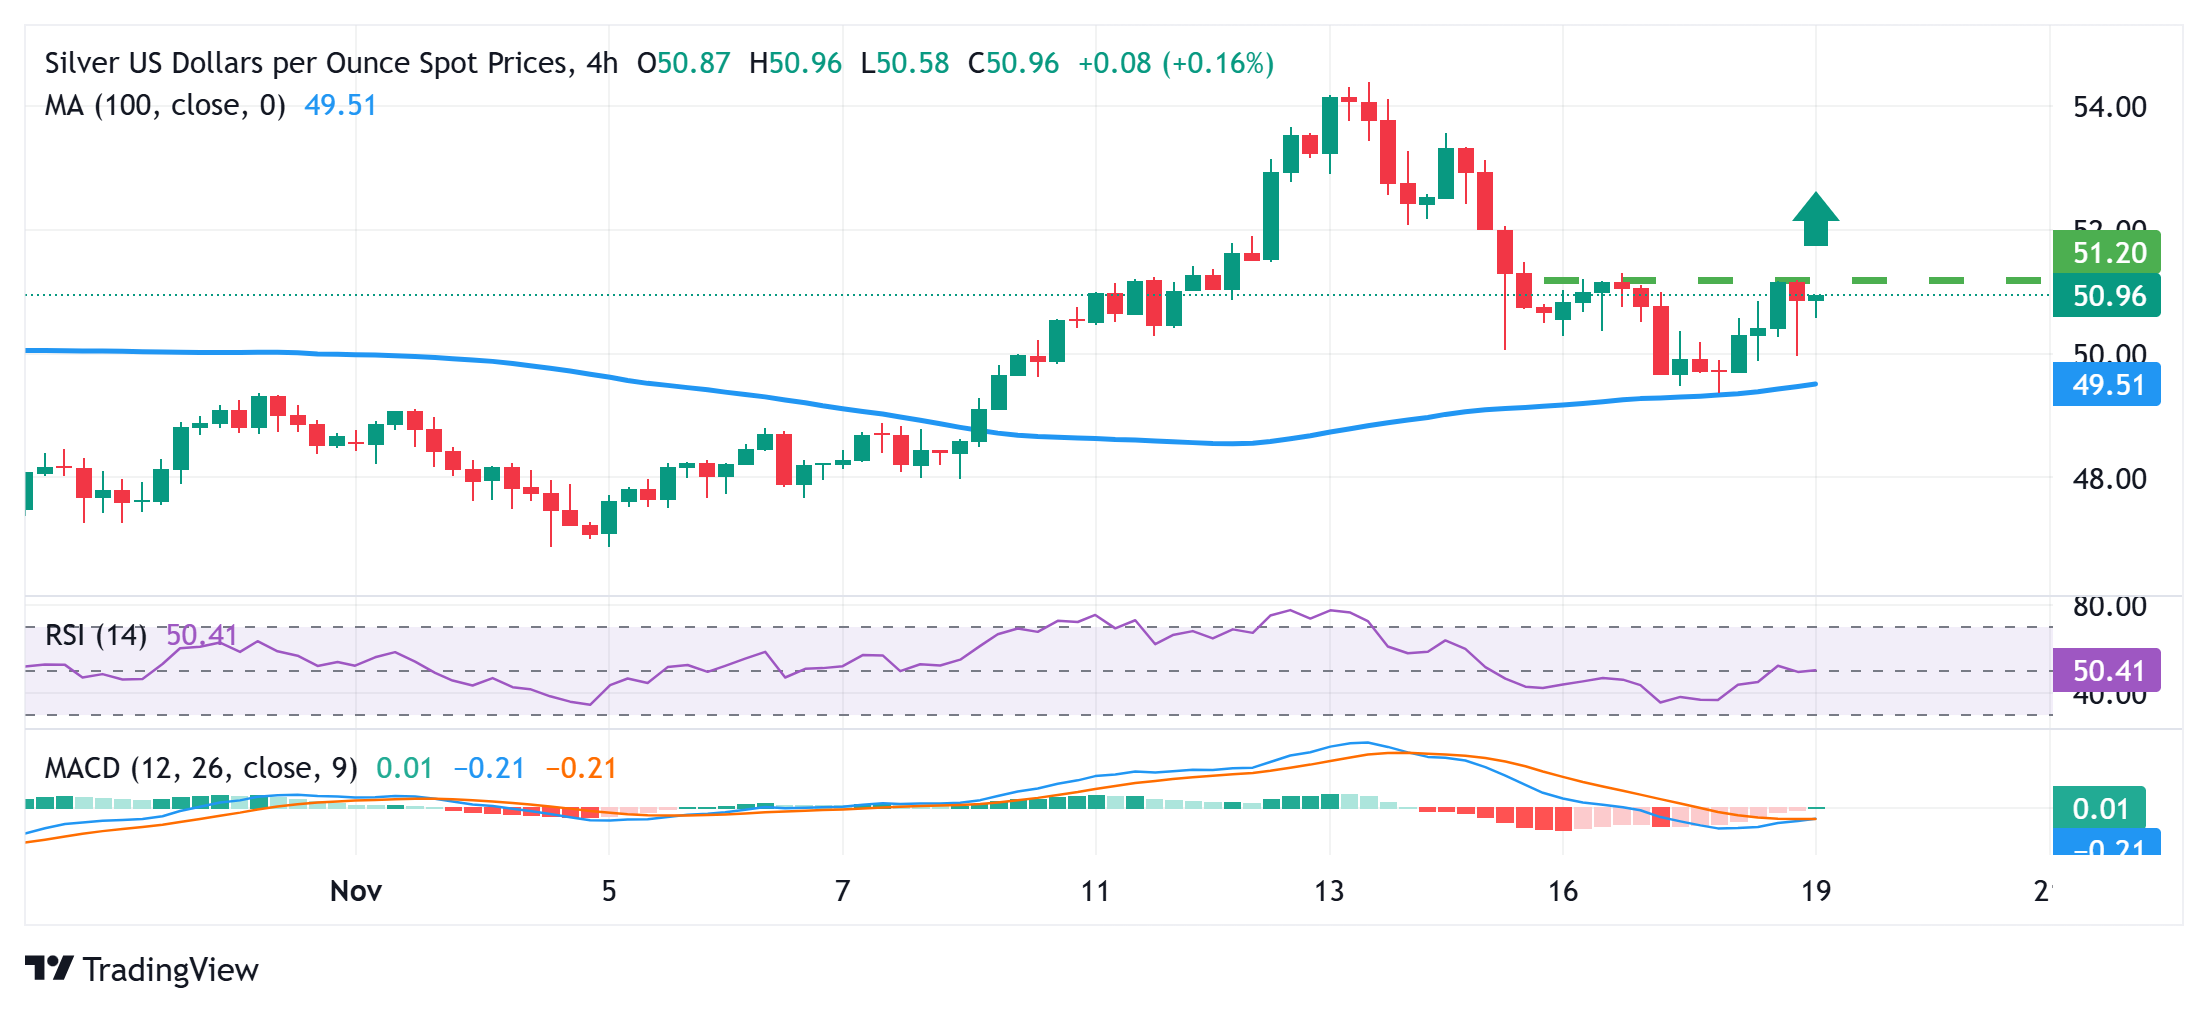
Silver (XAG/USD) reverses a modest Asian session dip to levels below the $50.00 psychological mark and looks to build on the previous day's bounce from an over one-week low. The white metal currently trades around the $50.80 region, nearly unchanged for the day, and could climb further while above the 100-period Simple Moving Average (SMA) on the 4-hour chart.
From a technical perspective, the overnight swing low, around the $49.35 region, coincides with the 100-period SMA on the 4-hour chart and should act as a key pivotal point. That said, neutral oscillators on 4-hour/daily charts make it prudent to wait for a convincing break below the said support before positioning for an extension of the XAG/USD pair's pullback from a nearly four-week high, touched last Thursday.
The white metal might then weaken below the $49.00 round figure and drop to the next relevant support near the mid-$48.00s. The downward trajectory could extend further and make the XAG/USD vulnerable to test sub-$48.00 levels. The subsequent decline would expose the $47.15-$47.10 intermediate support before the commodity eventually drops to the $46.55-$46.50 region en route to the $46.00 mark.
On the flip side, any further move up is likely to confront some resistance near the $51.00 mark. Some follow-through buying beyond the $51.15 horizontal barrier could allow the XAG/USD pair to climb further towards the $52.00 round figure. The momentum could extend to the $52.35 horizontal support breakpoint, which, if cleared, would be seen as a fresh trigger for bulls and pave the way for additional gains.
Silver 4-hour chart
Silver FAQs
Silver is a precious metal highly traded among investors. It has been historically used as a store of value and a medium of exchange. Although less popular than Gold, traders may turn to Silver to diversify their investment portfolio, for its intrinsic value or as a potential hedge during high-inflation periods. Investors can buy physical Silver, in coins or in bars, or trade it through vehicles such as Exchange Traded Funds, which track its price on international markets.
Silver prices can move due to a wide range of factors. Geopolitical instability or fears of a deep recession can make Silver price escalate due to its safe-haven status, although to a lesser extent than Gold's. As a yieldless asset, Silver tends to rise with lower interest rates. Its moves also depend on how the US Dollar (USD) behaves as the asset is priced in dollars (XAG/USD). A strong Dollar tends to keep the price of Silver at bay, whereas a weaker Dollar is likely to propel prices up. Other factors such as investment demand, mining supply – Silver is much more abundant than Gold – and recycling rates can also affect prices.
Silver is widely used in industry, particularly in sectors such as electronics or solar energy, as it has one of the highest electric conductivity of all metals – more than Copper and Gold. A surge in demand can increase prices, while a decline tends to lower them. Dynamics in the US, Chinese and Indian economies can also contribute to price swings: for the US and particularly China, their big industrial sectors use Silver in various processes; in India, consumers’ demand for the precious metal for jewellery also plays a key role in setting prices.
Silver prices tend to follow Gold's moves. When Gold prices rise, Silver typically follows suit, as their status as safe-haven assets is similar. The Gold/Silver ratio, which shows the number of ounces of Silver needed to equal the value of one ounce of Gold, may help to determine the relative valuation between both metals. Some investors may consider a high ratio as an indicator that Silver is undervalued, or Gold is overvalued. On the contrary, a low ratio might suggest that Gold is undervalued relative to Silver.
Author

Haresh Menghani
FXStreet
Haresh Menghani is a detail-oriented professional with 10+ years of extensive experience in analysing the global financial markets.


