Silver Price Forecast: XAG/USD bulls have the upper hand near mid-$34.00s, just below YTD top
- Silver consolidates in a narrow trading band just below the YTD peak touched on Monday.
- The bullish technical setup supports prospects for a further near-term appreciating move.
- Any corrective slide below the $33.00 mark is likely to get bought into and remain limited.

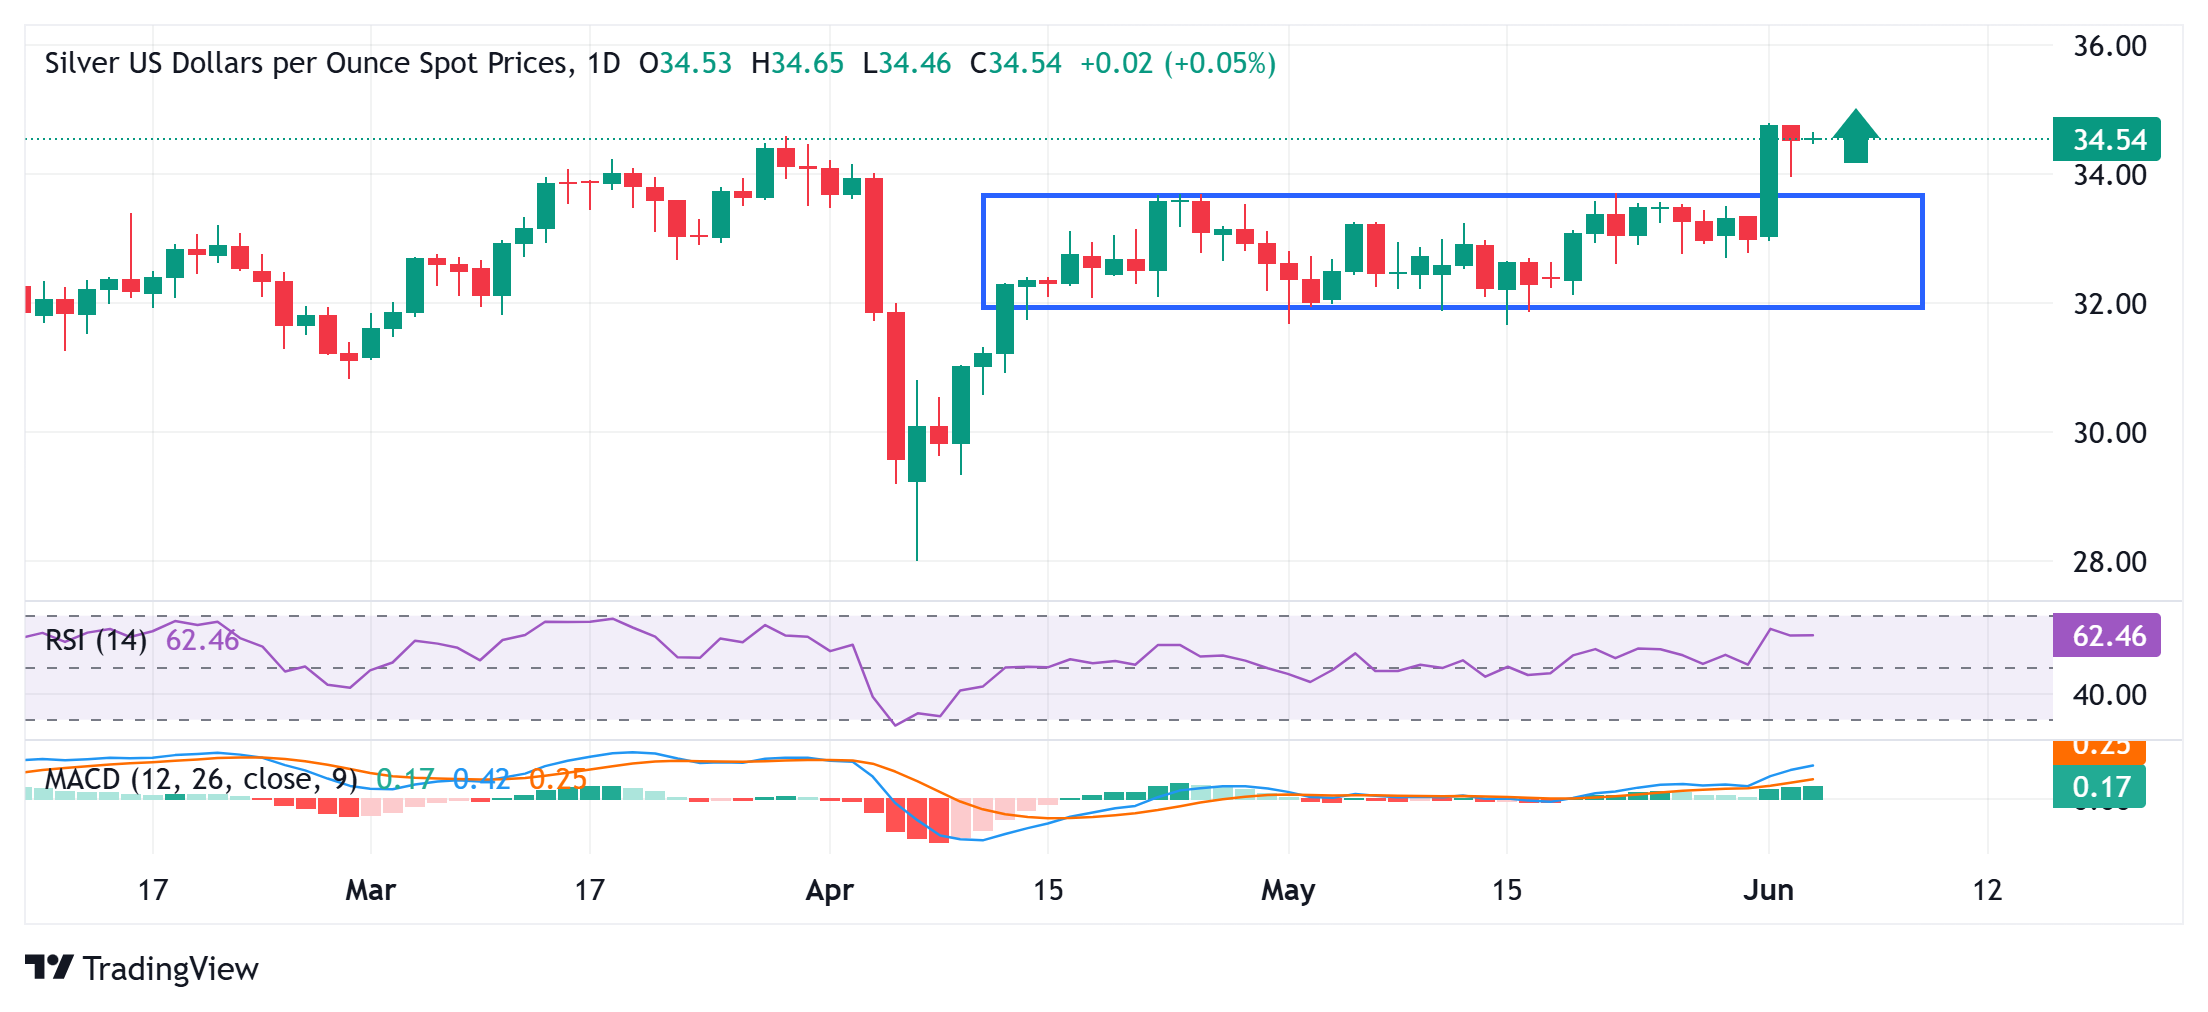
Silver (XAG/USD) struggles to capitalize on the overnight bounce from sub-$34.00 levels and oscillates in a narrow trading band during the Asian session on Wednesday. The white metal currently hovers around the $34.50 area, nearly unchanged for the day, though it remains close to the year-to-date peak (YTD) touched on Monday.
From a technical perspective, this week's breakout through the $33.80 barrier, or the top boundary of a multi-week-old range, was seen as a key trigger for bullish traders. Moreover, oscillators on the daily chart are holding comfortably in positive territory and are still away from being in the overbought zone. This, in turn, suggests that the path of least resistance for the XAG/USD is to the upside and backs the case for a further near-term appreciating move.
Some follow-through buying beyond the $34.8-$34.90 region, or the YTD top and a twelve-year high touched in October 2024, will reaffirm the constructive outlook and pave the way for additional gains. The XAG/USD might then accelerate the momentum towards the next relevant hurdle near the $35.66 area, or March 2012 swing high, before aiming to reclaim the $36.00 mark for the first time since February 2012.
On the flip side, corrective slides below the $34.00 mark could be seen as a buying opportunity and remain limited near the aforementioned trading range resistance breakpoint, around the $33.65 region. A sustained break below the latter, however, could drag the XAG/USD to the $33.00 round figure. This is followed by the $32.75-$32.70 strong horizontal support, which if broken decisively might shift the near-term bias in favor of bearish traders.
Silver daily chart
Silver FAQs
Silver is a precious metal highly traded among investors. It has been historically used as a store of value and a medium of exchange. Although less popular than Gold, traders may turn to Silver to diversify their investment portfolio, for its intrinsic value or as a potential hedge during high-inflation periods. Investors can buy physical Silver, in coins or in bars, or trade it through vehicles such as Exchange Traded Funds, which track its price on international markets.
Silver prices can move due to a wide range of factors. Geopolitical instability or fears of a deep recession can make Silver price escalate due to its safe-haven status, although to a lesser extent than Gold's. As a yieldless asset, Silver tends to rise with lower interest rates. Its moves also depend on how the US Dollar (USD) behaves as the asset is priced in dollars (XAG/USD). A strong Dollar tends to keep the price of Silver at bay, whereas a weaker Dollar is likely to propel prices up. Other factors such as investment demand, mining supply – Silver is much more abundant than Gold – and recycling rates can also affect prices.
Silver is widely used in industry, particularly in sectors such as electronics or solar energy, as it has one of the highest electric conductivity of all metals – more than Copper and Gold. A surge in demand can increase prices, while a decline tends to lower them. Dynamics in the US, Chinese and Indian economies can also contribute to price swings: for the US and particularly China, their big industrial sectors use Silver in various processes; in India, consumers’ demand for the precious metal for jewellery also plays a key role in setting prices.
Silver prices tend to follow Gold's moves. When Gold prices rise, Silver typically follows suit, as their status as safe-haven assets is similar. The Gold/Silver ratio, which shows the number of ounces of Silver needed to equal the value of one ounce of Gold, may help to determine the relative valuation between both metals. Some investors may consider a high ratio as an indicator that Silver is undervalued, or Gold is overvalued. On the contrary, a low ratio might suggest that Gold is undervalued relative to Silver.
Author

Haresh Menghani
FXStreet
Haresh Menghani is a detail-oriented professional with 10+ years of extensive experience in analysing the global financial markets.


