|

Silver Price Forecast: XAG/USD bounces from weekly lows towards $26.00 on risk-off sentiment

  • Silver weekly gains took a hit, after being up 6.50%, now sitting at 0.87%.
  • Risk-aversion in the financial markets dented the prospects for precious metals appetite.
  • XAG/USD Price Forecast: It is upward biased despite retracing to weekly lows.

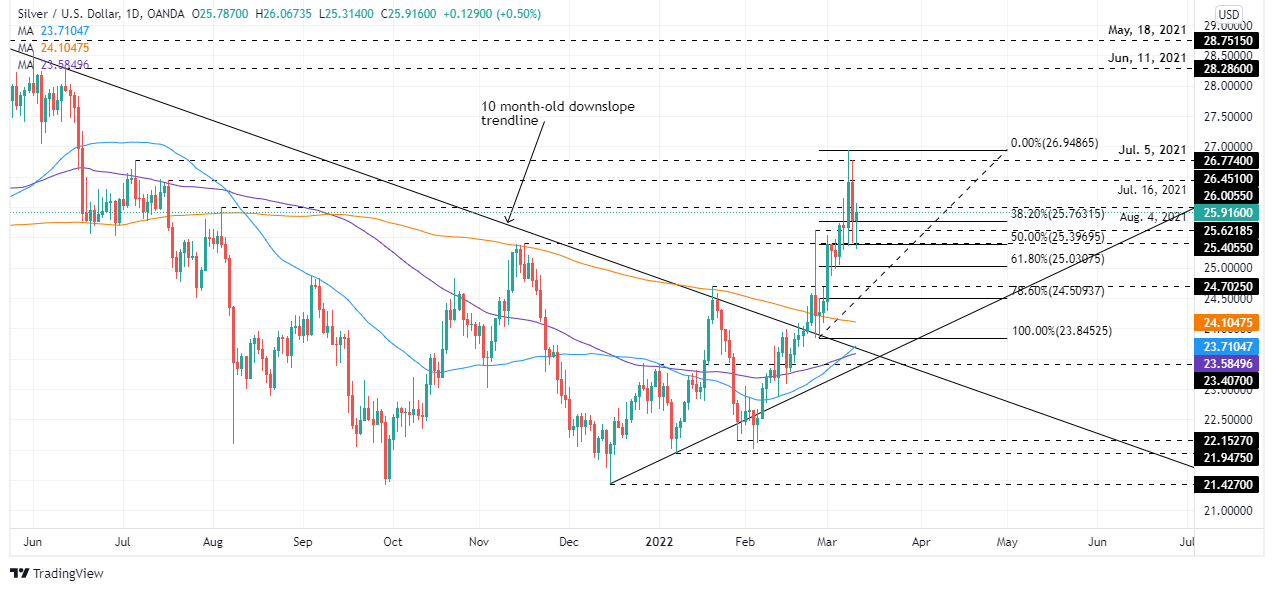
Silver (XAG/USD) bulls regained control late in the North American session, after reaching the 50% Fibonacci level around $25.31, also the day’s low. However, they staged a comeback and lifted the price of the white metal near the $26.00 mark. At the time of writing, XAG/USD is trading at $25.92.

Risk-aversion in the financial markets got back on Thursday. Russia-Ukraine discussions in Turkey failed to deliver some relief to investors, as talks did not advance regarding truce or ceasefire. Meanwhile, the US inflation figures showed that February’s headline Consumer Price Index rose by 7.95% y/y in line with expectations, while the so-called core CPI expanded by 6.4% y/y as foreseen.

Later in the day, US Initial Jobless Claims for the week ending on March 5 rose to 227K from 217K estimated.

The US Dollar Index, a gauge of the greenback’s value against a basket of its rivals, advanced some 0.56% during the day, sitting at 98.555, a headwind for the white metal.

In the overnight session, XAG/USD fell under $26.00, reaching a daily low near the 200-hour simple moving average (SMA) around $25.27, afterward rose to the $26.00 mark, which also confluences with August’s 2021 monthly high.

XAG/USD Price Forecast: Technical outlook

XAG/USD bias is upwards, though Thursday’s price action illustrates that silver bulls took a breather as they prepare to reclaim the $26.00 mark, which is the first resistance level at press time. Once cleared, the next stop would be $26.45 July 16, 2021 high, followed by July 5, 2021, daily high at $26.77, and then the $27.00 psychological area.

XAG/USD

Overview
Today last price25.92
Today Daily Change0.17
Today Daily Change %0.66
Today daily open25.75
 
Trends
Daily SMA2024.52
Daily SMA5023.65
Daily SMA10023.55
Daily SMA20024.09
 
Levels
Previous Daily High26.78
Previous Daily Low25.4
Previous Weekly High25.74
Previous Weekly Low24.1
Previous Monthly High25.62
Previous Monthly Low22.01
Daily Fibonacci 38.2%25.93
Daily Fibonacci 61.8%26.26
Daily Pivot Point S125.17
Daily Pivot Point S224.6
Daily Pivot Point S323.8
Daily Pivot Point R126.55
Daily Pivot Point R227.36
Daily Pivot Point R327.93

Author

Christian Borjon Valencia

Markets analyst, news editor, and trading instructor with over 14 years of experience across FX, commodities, US equity indices, and global macro markets.

More from Christian Borjon Valencia
Share:

Editor's Picks

AUD/USD eyes 0.7150 barrier nine-day EMA

AUD/USD inches higher after registering modest losses in the previous day, trading around 0.7130 during the Asian hours. The technical analysis of the daily chart indicates that the pair is moving sideways within the rectangle pattern, suggesting a consolidation as neither the bulls nor the bears have enough momentum to take control of the market.

USD/JPY trades below 160.00 intervention threshold; bullish bias intact

The USD/JPY pair attracts some sellers during the Asian session amid fears that authorities will step in again to prop up the Japanese Yen. Furthermore, the Israel-Lebanon truce prompts some profit-taking around the US Dollar and exerts downward pressure on the currency pair.

Gold puts its 200-day SMA to the test near $4,420

Gold keeps the bullish stance in place in the latter part of Thursday’s session, although a convincing break above the key $4,500 mark per troy ounce still remains elusive. The precious metal’s advance comes amid the resurgence of some selling interest around the Greenback, improving risk sentiment, and declining US Treasury yields across the board.

Bitcoin’s massive storm is back: Why the sell-off is far from over

Bitcoin price action over the last few weeks has felt less like a normal, healthy correction and more like a slow grinding crash that continues to wreak havoc on holdings and trading accounts. And everything suggests that the dramatic crash isn’t over.

Nonfarm payrolls: Testing the limits of Fed policy patience

The upcoming nonfarm payrolls report for May will provide the final update on the US labor market before Kevin Warsh attends his first policy meeting as the new Fed Chair later this month.

Recession on paper: What really moves the Canadian Loonie now?

Statistics Canada handed the headline writers a gift and the analysts a headache. Real GDP shrank 0.1% on an annualized basis in the first quarter, and with the fourth quarter of 2025 revised down to a 1.0% contraction, that is two negative quarters in a row, the textbook definition of a technical recession and Canada's first since the pandemic.