Silver Price Forecast: XAG/USD approaches $29 ahead of US PPI, jobless claims
- Silver price moves higher towards $29 even though traders pare Fed large rate cut bets.
- The US Dollar and bond yields rise as the US CPI data for August shows signs of stickiness.
- Investors await the US PPI and the Initial Jobless Claims data.

Silver price (XAG/USD) edges higher towards the crucial resistance of $29.00 in Thursday’s European session. The white metal rises slightly despite investors seem confident that the Federal Reserve (Fed) will start reducing interest rates gradually by 25 basis points (bps) to 5.00%-5.25% this month.
Market speculation for the Fed starting to reduce its key borrowing rates aggressively has diminished significantly as Wednesday’s United States (US) Consumer Price Index (CPI) data for August showed signs of stickiness in inflationary pressures. Annual US core inflation - which excludes volatile food and energy prices – rose in line with estimates and the prior release of 3.2%.
Declining market expectation for Fed interest rate cut by 50 bps has uplifted the US Dollar (USD) and bond yields. The US Dollar Index (DXY), which tracks the Greenback’s value against six major currencies, clings to gains near 101.70. 10-year US Treasury yields rise to 3.67%. Generally, higher yields on interest-bearing assets weigh on the Silver price, given that they increase the opportunity cost of holding an investment in non-yielding assets, such as Silver. But, in this case, the Silver price remains firm.
Going forward, investors will focus on the US Producer Price Index (PPI) data for August, which will be published at 12:30 GMT. The core PPI is estimated to have accelerated further. At the same time, investors will also focus on the US Initial Jobless Claims data for the week ending September 6.
The significance of the jobless claims data has increased in last few weeks as recent comments from a string of Fed officials signal that the central bank has become more concerned over preventing job losses.
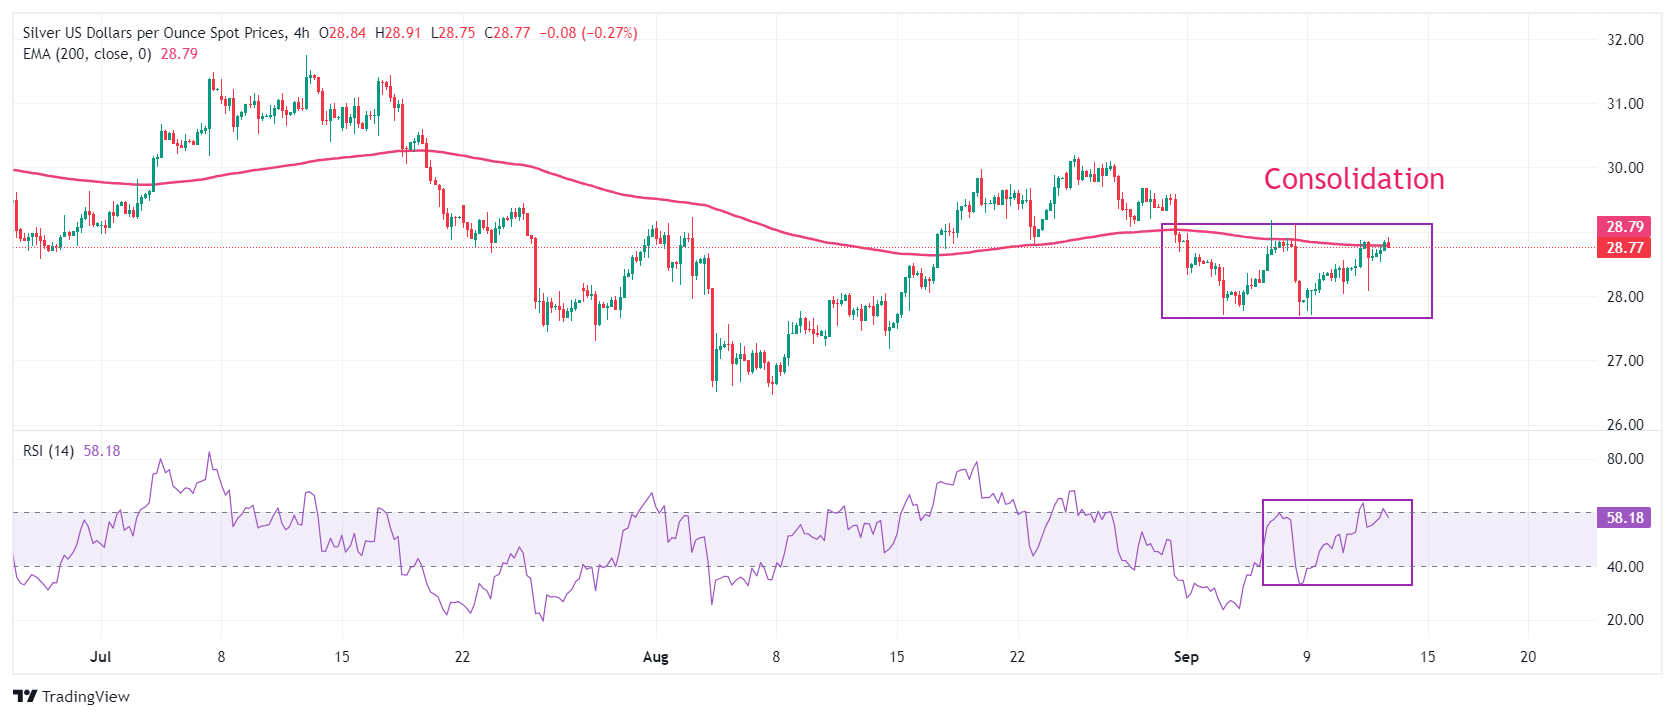
Silver technical analysis
Silver price trades in a limited range of $27.70-$29.20 from more than a week. The upside in the white metal remains restricted by the 200-period Exponential Moving Average (EMA), which trades around $28.80.
The 14-period Relative Strength Index (RSI) oscillates in the 40.00-60.00 range, exhibiting a sideways trend.
Silver four-hour chart
(This story was corrected on September 12 at 11:30 GMT to say that Silver price trades in a limited range of $27.70-$29.20, not $27.70-$28.20.)
Silver FAQs
Silver is a precious metal highly traded among investors. It has been historically used as a store of value and a medium of exchange. Although less popular than Gold, traders may turn to Silver to diversify their investment portfolio, for its intrinsic value or as a potential hedge during high-inflation periods. Investors can buy physical Silver, in coins or in bars, or trade it through vehicles such as Exchange Traded Funds, which track its price on international markets.
Silver prices can move due to a wide range of factors. Geopolitical instability or fears of a deep recession can make Silver price escalate due to its safe-haven status, although to a lesser extent than Gold's. As a yieldless asset, Silver tends to rise with lower interest rates. Its moves also depend on how the US Dollar (USD) behaves as the asset is priced in dollars (XAG/USD). A strong Dollar tends to keep the price of Silver at bay, whereas a weaker Dollar is likely to propel prices up. Other factors such as investment demand, mining supply – Silver is much more abundant than Gold – and recycling rates can also affect prices.
Silver is widely used in industry, particularly in sectors such as electronics or solar energy, as it has one of the highest electric conductivity of all metals – more than Copper and Gold. A surge in demand can increase prices, while a decline tends to lower them. Dynamics in the US, Chinese and Indian economies can also contribute to price swings: for the US and particularly China, their big industrial sectors use Silver in various processes; in India, consumers’ demand for the precious metal for jewellery also plays a key role in setting prices.
Silver prices tend to follow Gold's moves. When Gold prices rise, Silver typically follows suit, as their status as safe-haven assets is similar. The Gold/Silver ratio, which shows the number of ounces of Silver needed to equal the value of one ounce of Gold, may help to determine the relative valuation between both metals. Some investors may consider a high ratio as an indicator that Silver is undervalued, or Gold is overvalued. On the contrary, a low ratio might suggest that Gold is undervalued relative to Silver.
Author

Sagar Dua
FXStreet
Sagar Dua is associated with the financial markets from his college days. Along with pursuing post-graduation in Commerce in 2014, he started his markets training with chart analysis.


