Silver Price Forecast: RSI divergence emerges as XAG/USD eases after hitting record highs
- Silver slips as traders book profits after Wednesday’s record high near $58.98.
- Dovish Fed expectations, strong demand and tightening supply keep the broader outlook constructive.
- Technically, the daily chart shows RSI divergence, hinting at cooling momentum while the uptrend holds.

Silver (XAG/USD) trades on the back foot on Thursday as bulls take a breather and book partial profits after the metal climbed to record highs near $58.98 on Wednesday. At the time of writing, XAG/USD is trading around $56.87, down roughly 2.77% on the day.
The fundamental backdrop remains constructive for Silver, helped by dovish Federal Reserve (Fed) expectations, resilient industrial and investment demand, and a tightening supply environment that has helped propel the metal to a near 100% gain year-to-date.
Meanwhile, a Gold-Silver ratio near 73 highlights Silver’s relative outperformance within the precious metals space, suggesting further upside potential for XAG/USD.
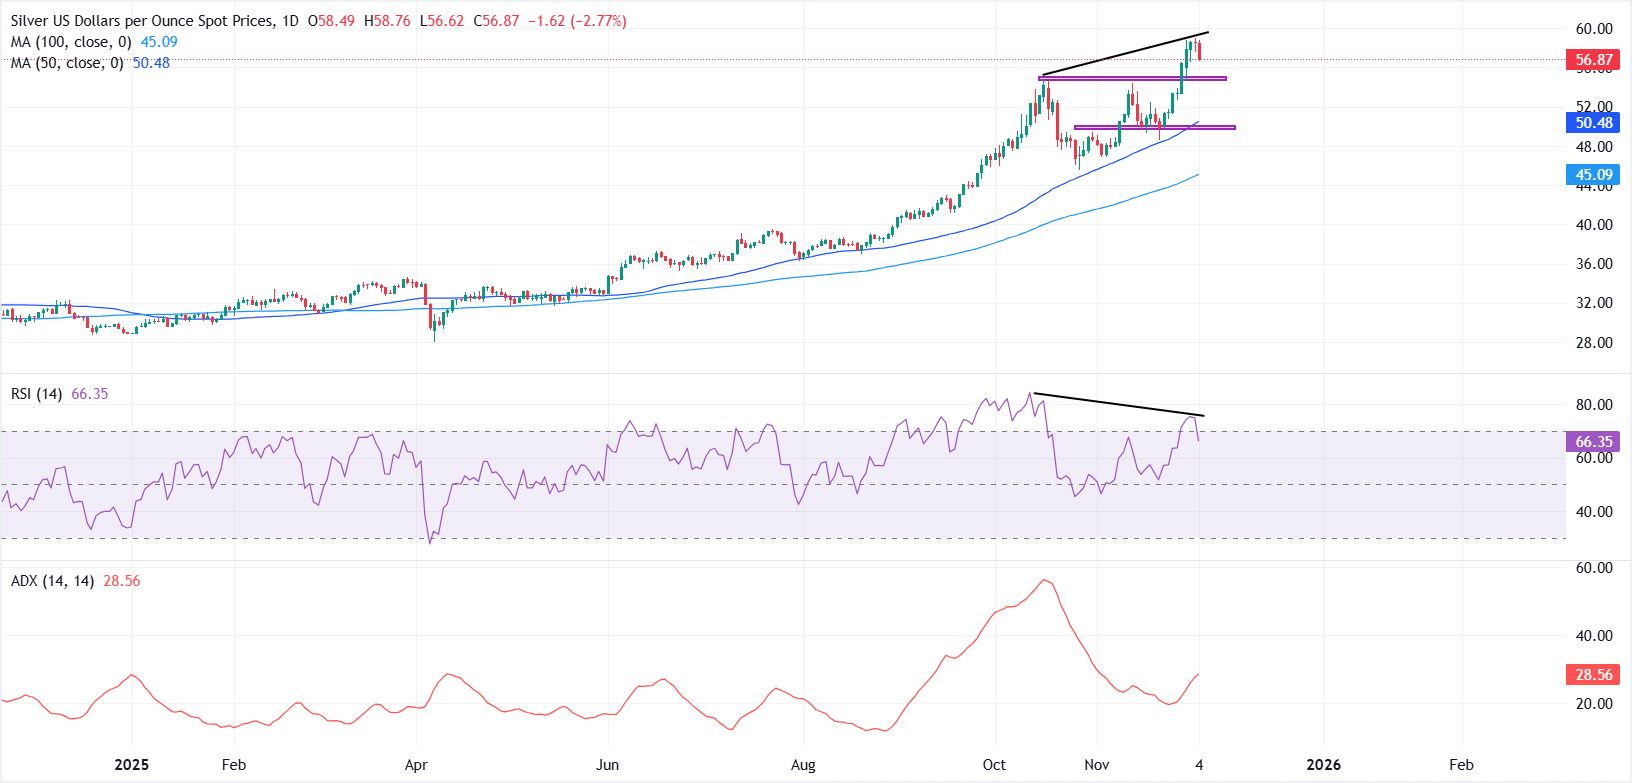
From a technical perspective, the daily chart shows early signs of fatigue, with price action stalling below the record high. A bearish divergence has emerged between price and the Relative Strength Index (RSI), signalling cooling momentum, though a strong reversal still appears unlikely as the broader uptrend remains intact.
Prices continue to hold well above key moving averages, keeping the bias tilted to the upside. Initial support is seen around $55.00, and a decisive break below this zone could open the door to a deeper pullback toward $50.00, where the 50-day Simple Moving Average (SMA) is likely to cushion the downside.
On the upside, a sustained break above the all-time high at $58.98 would push Silver deeper into uncharted territory, exposing the $60.00 psychological level as the next bullish target.
The Average Directional Index (ADX) at 28.56 rises, reinforcing a strengthening directional bias; sustained trend strength would favor further upside as long as price holds above the 50-day SMA.
Silver FAQs
Silver is a precious metal highly traded among investors. It has been historically used as a store of value and a medium of exchange. Although less popular than Gold, traders may turn to Silver to diversify their investment portfolio, for its intrinsic value or as a potential hedge during high-inflation periods. Investors can buy physical Silver, in coins or in bars, or trade it through vehicles such as Exchange Traded Funds, which track its price on international markets.
Silver prices can move due to a wide range of factors. Geopolitical instability or fears of a deep recession can make Silver price escalate due to its safe-haven status, although to a lesser extent than Gold's. As a yieldless asset, Silver tends to rise with lower interest rates. Its moves also depend on how the US Dollar (USD) behaves as the asset is priced in dollars (XAG/USD). A strong Dollar tends to keep the price of Silver at bay, whereas a weaker Dollar is likely to propel prices up. Other factors such as investment demand, mining supply – Silver is much more abundant than Gold – and recycling rates can also affect prices.
Silver is widely used in industry, particularly in sectors such as electronics or solar energy, as it has one of the highest electric conductivity of all metals – more than Copper and Gold. A surge in demand can increase prices, while a decline tends to lower them. Dynamics in the US, Chinese and Indian economies can also contribute to price swings: for the US and particularly China, their big industrial sectors use Silver in various processes; in India, consumers’ demand for the precious metal for jewellery also plays a key role in setting prices.
Silver prices tend to follow Gold's moves. When Gold prices rise, Silver typically follows suit, as their status as safe-haven assets is similar. The Gold/Silver ratio, which shows the number of ounces of Silver needed to equal the value of one ounce of Gold, may help to determine the relative valuation between both metals. Some investors may consider a high ratio as an indicator that Silver is undervalued, or Gold is overvalued. On the contrary, a low ratio might suggest that Gold is undervalued relative to Silver.
Author

Vishal Chaturvedi
FXStreet
I am a macro-focused research analyst with over four years of experience covering forex and commodities market. I enjoy breaking down complex economic trends and turning them into clear, actionable insights that help traders stay ahead of the curve.


