|

Silver Price Analysis: XAG/USD tumbles and remains bearish below $29.00

  • Silver drops influenced by Fed's Core PCE Price Index anticipation.
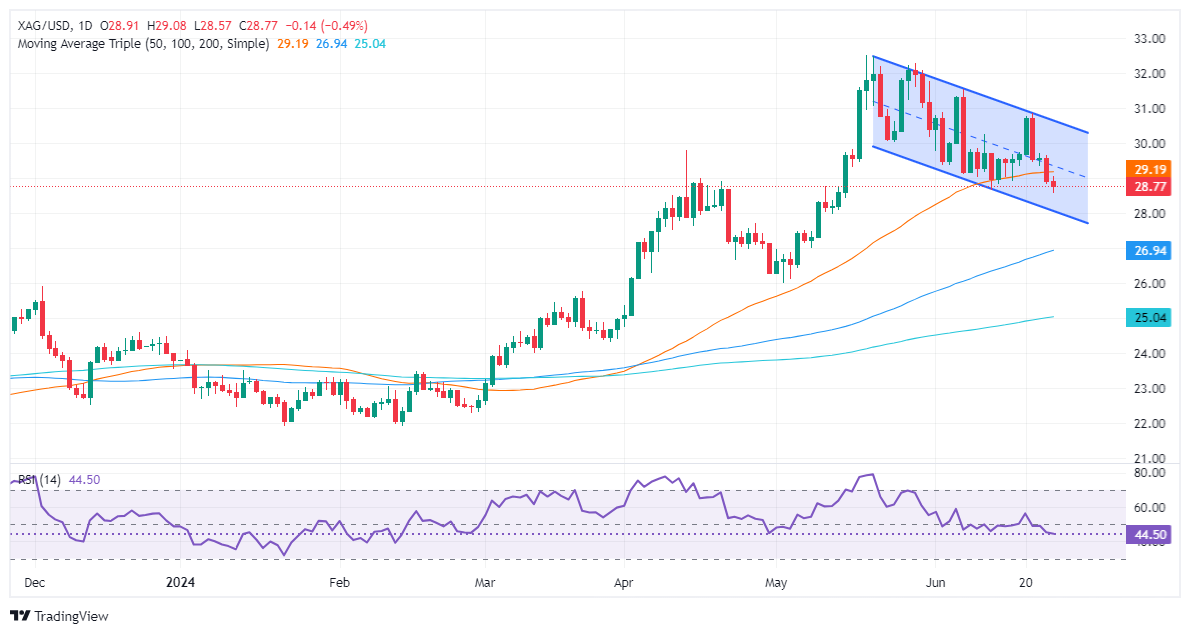
  • Last week's bearish engulfing pattern and RSI hint at more declines.
  • Support levels: $28.28 (June 10 high), $28.00, $27.01 (May 8 low), $26.82 (100-DMA).
  • Resistance points: $29.17 (50-DMA), $31.54 (June 7 high), $32.00, $32.51 (YTD high).

Silver price fell on Wednesday as market participants awaited the release of the Fed’s  preferred inflation gauge, the core Personal Consumption Expenditure (PCE) Price Index, after releases from major countries hinted at a reacceleration of inflation. The XAG/USD spot price is at $28.76, down by 0.46%.

XAG/USD Price Analysis: Technical outlook

The grey metal formed a ‘bearish engulfing’ chart pattern last week, indicating potential for further downside. Momentum support sellers, as measured by the bearish Relative Strength Index (RSI), suggest that silver could extend its losses.

Therefore, XAG/USD's first support is the June 10, 2021, high at $28.28. A breach of the latter will expose the psychological $28.00 mark, followed by the May 8 swing low of $27.01, ahead of the 100-DMA at $26.82.

Conversely, if XAG/USD resumes its uptrend, the next resistance level would be the 50-day moving average (DMA) at $29.17. Surpassing this level would target the June 7 high of $31.54. Clearing this would aim for $32.00 before challenging the year-to-date (YTD) high of $32.51.

XAG/USD Price Action – Daily Chart

XAG/USD

Overview
Today last price28.77
Today Daily Change-0.14
Today Daily Change %-0.48
Today daily open28.91
 
Trends
Daily SMA2029.95
Daily SMA5029.18
Daily SMA10026.88
Daily SMA20025.01
 
Levels
Previous Daily High29.67
Previous Daily Low28.84
Previous Weekly High30.86
Previous Weekly Low28.93
Previous Monthly High32.51
Previous Monthly Low26.02
Daily Fibonacci 38.2%29.16
Daily Fibonacci 61.8%29.35
Daily Pivot Point S128.61
Daily Pivot Point S228.32
Daily Pivot Point S327.79
Daily Pivot Point R129.44
Daily Pivot Point R229.96
Daily Pivot Point R330.26

Author

Christian Borjon Valencia

Markets analyst, news editor, and trading instructor with over 14 years of experience across FX, commodities, US equity indices, and global macro markets.

More from Christian Borjon Valencia
Share:

Editor's Picks

AUD/USD eyes 0.7150 barrier nine-day EMA

AUD/USD inches higher after registering modest losses in the previous day, trading around 0.7130 during the Asian hours. The technical analysis of the daily chart indicates that the pair is moving sideways within the rectangle pattern, suggesting a consolidation as neither the bulls nor the bears have enough momentum to take control of the market.

USD/JPY trades below 160.00 intervention threshold; bullish bias intact

The USD/JPY pair attracts some sellers during the Asian session amid fears that authorities will step in again to prop up the Japanese Yen. Furthermore, the Israel-Lebanon truce prompts some profit-taking around the US Dollar and exerts downward pressure on the currency pair.

Gold puts its 200-day SMA to the test near $4,420

Gold keeps the bullish stance in place in the latter part of Thursday’s session, although a convincing break above the key $4,500 mark per troy ounce still remains elusive. The precious metal’s advance comes amid the resurgence of some selling interest around the Greenback, improving risk sentiment, and declining US Treasury yields across the board.

Bitcoin’s massive storm is back: Why the sell-off is far from over

Bitcoin price action over the last few weeks has felt less like a normal, healthy correction and more like a slow grinding crash that continues to wreak havoc on holdings and trading accounts. And everything suggests that the dramatic crash isn’t over.

Nonfarm payrolls: Testing the limits of Fed policy patience

The upcoming nonfarm payrolls report for May will provide the final update on the US labor market before Kevin Warsh attends his first policy meeting as the new Fed Chair later this month.

Recession on paper: What really moves the Canadian Loonie now?

Statistics Canada handed the headline writers a gift and the analysts a headache. Real GDP shrank 0.1% on an annualized basis in the first quarter, and with the fourth quarter of 2025 revised down to a 1.0% contraction, that is two negative quarters in a row, the textbook definition of a technical recession and Canada's first since the pandemic.