Silver Price Analysis: XAG/USD struggles near YTD lows, remains vulnerable


  • Silver witnessed fresh selling on Wednesday and drifted back closer to YTD lows.
  • The set-up favours bearish traders and supports prospects for additional losses.
  • Bears might wait for a break below the $22.00 mark before placing fresh bets.

Silver struggled to capitalize on the overnight bounce from the vicinity of YTD lows, instead met with some fresh supply on Wednesday. The commodity remained depressed heading into the North American session and was last seen trading around the $22.25-20 region, down nearly 1% for the day.

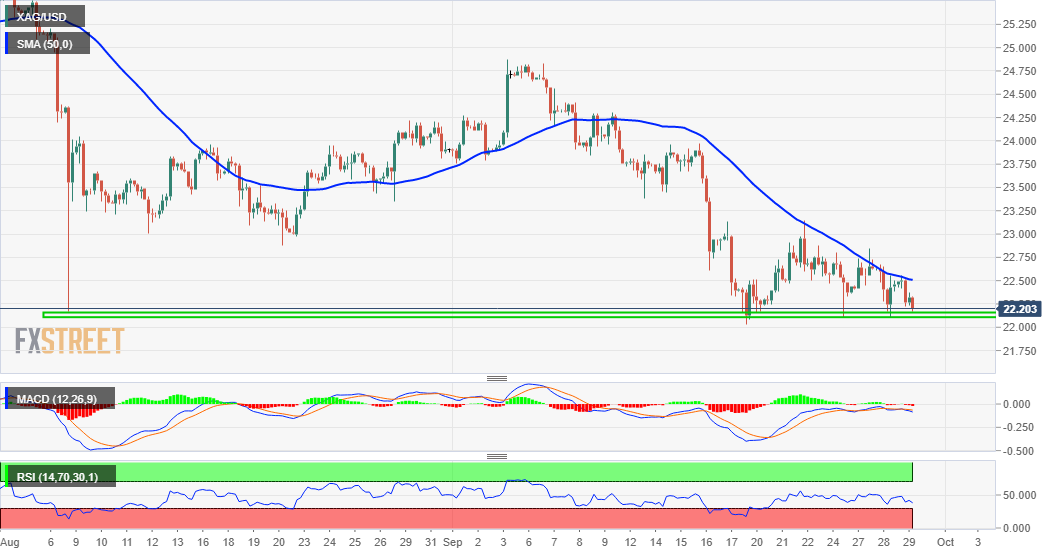
Looking at the technical picture, attempted recoveries have repeated failed near the downward sloping 50-period SMA resistance on the 4-hour chart. However, the XAG/USD, so far, has shown some resilience near the $22.00 round figure, which should now act as a key pivotal point for traders.

Meanwhile, technical indicators on the daily chart are holding deep in the bearish territory and are still far from being in the oversold zone. This, in turn, supports prospects for an eventual break below the $22.00 handle and an extension of over three-week-old downward trajectory.

The XAG/USD might then accelerate the slide towards challenging September 2020 swing lows support, around the $21.65 region, before dropping to the $21.00 round-figure mark.

On the flip side, the 50-period SMA on the 4-hour chart, currently around mid-$22.00s might continue to act as a strong resistance. This is followed by the $22.80 supply zone, above which the XAG/USD could surpass the $23.00 mark and test the next relevant hurdle near the $23.15 area.

Silver 4-hour chart

fxsoriginal

Technical levels to watch

XAG/USD

Overview
Today last price 22.23
Today Daily Change -0.22
Today Daily Change % -0.98
Today daily open 22.45
 
Trends
Daily SMA20 23.39
Daily SMA50 23.93
Daily SMA100 25.41
Daily SMA200 25.78
 
Levels
Previous Daily High 22.67
Previous Daily Low 22.1
Previous Weekly High 23.15
Previous Weekly Low 22.04
Previous Monthly High 26
Previous Monthly Low 22.17
Daily Fibonacci 38.2% 22.32
Daily Fibonacci 61.8% 22.45
Daily Pivot Point S1 22.15
Daily Pivot Point S2 21.84
Daily Pivot Point S3 21.58
Daily Pivot Point R1 22.72
Daily Pivot Point R2 22.98
Daily Pivot Point R3 23.28


Share: Feed news

Information on these pages contains forward-looking statements that involve risks and uncertainties. Markets and instruments profiled on this page are for informational purposes only and should not in any way come across as a recommendation to buy or sell in these assets. You should do your own thorough research before making any investment decisions. FXStreet does not in any way guarantee that this information is free from mistakes, errors, or material misstatements. It also does not guarantee that this information is of a timely nature. Investing in Open Markets involves a great deal of risk, including the loss of all or a portion of your investment, as well as emotional distress. All risks, losses and costs associated with investing, including total loss of principal, are your responsibility. The views and opinions expressed in this article are those of the authors and do not necessarily reflect the official policy or position of FXStreet nor its advertisers. The author will not be held responsible for information that is found at the end of links posted on this page.

If not otherwise explicitly mentioned in the body of the article, at the time of writing, the author has no position in any stock mentioned in this article and no business relationship with any company mentioned. The author has not received compensation for writing this article, other than from FXStreet.

FXStreet and the author do not provide personalized recommendations. The author makes no representations as to the accuracy, completeness, or suitability of this information. FXStreet and the author will not be liable for any errors, omissions or any losses, injuries or damages arising from this information and its display or use. Errors and omissions excepted.

The author and FXStreet are not registered investment advisors and nothing in this article is intended to be investment advice.

Recommended content


Recommended content

Editors’ Picks

EUR/USD regains traction, recovers above 1.0700

EUR/USD regains traction, recovers above 1.0700

EUR/USD regained its traction and turned positive on the day above 1.0700 in the American session. The US Dollar struggles to preserve its strength after the data from the US showed that the economy grew at a softer pace than expected in Q1.

EUR/USD News

GBP/USD returns to 1.2500 area in volatile session

GBP/USD returns to 1.2500 area in volatile session

GBP/USD reversed its direction and recovered to 1.2500 after falling to the 1.2450 area earlier in the day. Although markets remain risk-averse, the US Dollar struggles to find demand following the disappointing GDP data.

GBP/USD News

Gold climbs above $2,340 following earlier drop

Gold climbs above $2,340 following earlier drop

Gold fell below $2,320 in the early American session as US yields shot higher after the data showed a significant increase in the US GDP price deflator in Q1. With safe-haven flows dominating the markets, however, XAU/USD reversed its direction and rose above $2,340.

Gold News

XRP extends its decline, crypto experts comment on Ripple stablecoin and benefits for XRP Ledger

XRP extends its decline, crypto experts comment on Ripple stablecoin and benefits for XRP Ledger

Ripple extends decline to $0.52 on Thursday, wipes out weekly gains. Crypto expert asks Ripple CTO how the stablecoin will benefit the XRP Ledger and native token XRP. 

Read more

After the US close, it’s the Tokyo CPI

After the US close, it’s the Tokyo CPI

After the US close, it’s the Tokyo CPI, a reliable indicator of the national number and then the BoJ policy announcement. Tokyo CPI ex food and energy in Japan was a rise to 2.90% in March from 2.50%.

Read more

Forex MAJORS

Cryptocurrencies

Signatures