|

Silver Price Analysis: XAG/USD stays above 100-day SMA despite recent pullback

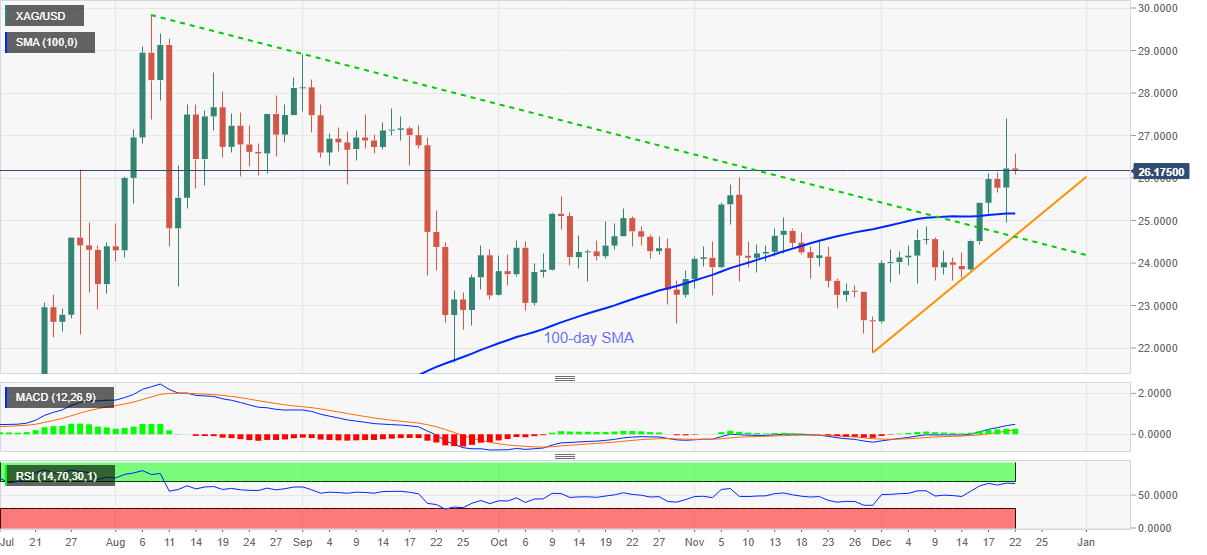
  • Silver refreshes intraday low following a pullback from $26.58.
  • Sustained break of medium-term resistance line, 100-day SMA favor buyers.
  • Monthly support line adds to the downside filters.

Silver declines to $26.09, down 0.33% intraday, during the pre-European trading on Tuesday. Even so, the white metal remains above 100-day SMA amid bullish MACD.

As a result, silver bulls are geared towards the mid-September highs, near $27.60, with the previous day’s top near $27.40 acting as an immediate upside barrier.

While RSI conditions may challenge the bullion buyer beyond $27.60, highs marked in September and August, respectively around $28.90 and $29.85, will add to the upside filters ahead of the $30.00 threshold.

On the contrary, a downside break below the 100-day SMA level of $25.16 needs to slip beneath the confluence of a downward sloping trend line from early August as well as an ascending support line from November 30, around $24.60.

It should, however, be noted that a daily closing below $24.60 will not refrain from challenging the November lows surrounding $21.90.

Silver daily chart
Trend: Bullish

Additional important levels

Overview
Today last price26.25
Today Daily Change0.03
Today Daily Change %0.11%
Today daily open26.22
 
Trends
Daily SMA2024.21
Daily SMA5024.27
Daily SMA10025.16
Daily SMA20021.12
 
Levels
Previous Daily High27.41
Previous Daily Low24.96
Previous Weekly High26.13
Previous Weekly Low23.67
Previous Monthly High26.01
Previous Monthly Low21.9
Daily Fibonacci 38.2%26.47
Daily Fibonacci 61.8%25.9
Daily Pivot Point S124.99
Daily Pivot Point S223.75
Daily Pivot Point S322.53
Daily Pivot Point R127.44
Daily Pivot Point R228.65
Daily Pivot Point R329.89

Author

Anil Panchal

Anil Panchal

FXStreet

Anil Panchal has nearly 15 years of experience in tracking financial markets. With a keen interest in macroeconomics, Anil aptly tracks global news/updates and stays well-informed about the global financial moves and their implications.


More from Anil Panchal
Share:

Editor's Picks

GBP/USD flirts with tops near 1.3470

GBP/USD manages to regain composure and challenge the area of daily highs around 1.3470 on Friday. Cable picks up pace despite marginal gains in the Greenback in a context of swelling geopolitical tensions and rising global oil prices.

EUR/USD struggles above 1.1500 despite USD weakness

EUR/USD struggles with its recovery above 1.1500 in European trading on Monday, despite broad US Dollar weakness and improved risk sentiment. The USD loses traction following US President Trump's call off an attack on Iran and that talks between the two sides would happen on Monday. Traders will closely monitor the developments surrounding US-Iran negotiations and US ISM PMI data.

Gold extends range play below $4,100 as rebounding USD meets receding Fed hike bets

Gold struggles to capitalize on a modest weekly bullish gap opening, and remains below the $4,100 mark heading into the European session. The US Dollar stages a modest recovery from its lowest level since June 17, which is seen capping the upside for the commodity. The upside for the USD, however, seems limited amid renewed hopes for a US-Iran peace deal and receding US Fed rate-hike expectations.

Week ahead: US payrolls report and AI earnings to keep investors on edge

After the Fed decision, NFP report awaited for more rate hike clues. Employment also on the agenda in Canada and New Zealand. Chinese trade and Japanese wage data to be watched too. But Iran and AI headlines to remain in driver’s seat for risk sentiment.

Solana risks a steeper decline below $70 despite steady ETF inflows

Solana (SOL) is trading in the red, losing bullish momentum and remaining capped below its 50-day Exponential Moving Average at $75.68. SOL-focused Exchange Traded Funds show resilience with a monthly inflow of $14.62 million in July, while the near-term retail support wanes with the funding rate turning negative.

9-3: Is the Federal Reserve’s vote tally Warsh's new forward guidance?
The rate did not move. Neither did the statement, and that’s the more interesting fact. Set the July 29 Federal Open Market Committee (FOMC) statement beside the one issued on June 17, and the two documents are identical apart from a single verb and a paragraph at the bottom naming three dissenters.














