|

Silver Price Analysis: XAG/USD slides to two-week low, seems vulnerable to slide further

  • Silver drifts lower for the second straight day and drops to a near two-week trough.
  • The technical setup favours bearish traders and supports prospects for further losses.
  • A sustained strength beyond the 200-day SMA is needed to negate the negative bias.

Silver (XAG/USD) remains under some selling pressure for the second successive day on Monday and drops to a near two-week low, below mid-$22.00s during the first half of the European session.

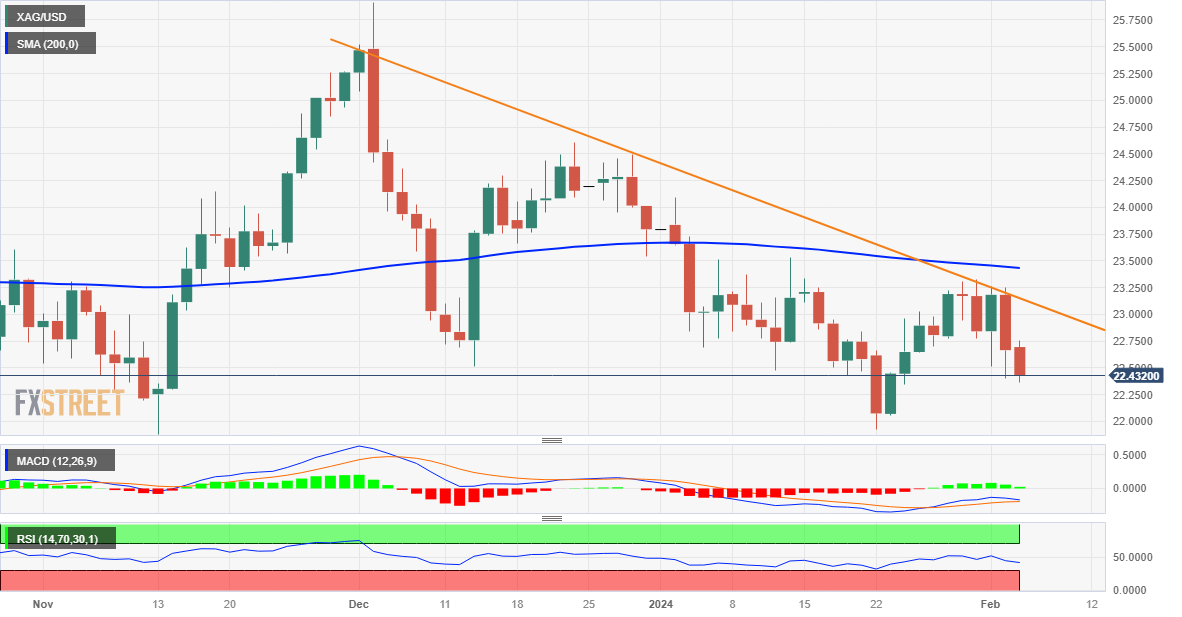
From a technical perspective, the recent repeated failures ahead of the very important 200-day Simple Moving Average (SMA) and the subsequent downfall favour bearish traders. Moreover, oscillators on the daily chart have again started drifting in the negative territory and suggest that the path of least resistance for the XAG/USD is to the downside.

Hence, some follow-through decline towards retesting sub-$22.00 levels, or a two-month low touched in January, looks like a distinct possibility. The downward trajectory could get extended further towards the $21.40-$21.35 intermediate support before the XAG/USD breaks below the $21.00 mark, towards the October swing low near the $20.70-$20.65 zone.

On the flip side, any meaningful recovery attempt is likely to confront stiff resistance ahead of the $23.00 round-figure mark. This is followed by by the $23.25-$23.30 supply zone, which nears the 200-day SMA, which if cleared decisively should set the stage for additional gains and allow the XAG/USD to aim back towards reclaiming the $24.00 round figure.

Some follow-through buying has the potential to lift the XAG/USD towards the next relevant hurdle near the $24.50-$24.60 area and the $25.00 psychological mark. The momentum could get extended further and lift the white metal to the $25.45-$25.50 intermediate barrier en route to the $26.00 neighbourhood, or the December swing high.

Silver daily chart

fxsoriginal

Technical levels to watch

XAG/USD

Overview
Today last price22.42
Today Daily Change-0.25
Today Daily Change %-1.10
Today daily open22.67
 
Trends
Daily SMA2022.84
Daily SMA5023.53
Daily SMA10023.15
Daily SMA20023.45
 
Levels
Previous Daily High23.25
Previous Daily Low22.4
Previous Weekly High23.33
Previous Weekly Low22.4
Previous Monthly High24.09
Previous Monthly Low21.93
Daily Fibonacci 38.2%22.73
Daily Fibonacci 61.8%22.93
Daily Pivot Point S122.29
Daily Pivot Point S221.92
Daily Pivot Point S321.44
Daily Pivot Point R123.14
Daily Pivot Point R223.62
Daily Pivot Point R324

Author

Haresh Menghani

Haresh Menghani is a detail-oriented professional with 10+ years of extensive experience in analysing the global financial markets.

More from Haresh Menghani
Share:

Editor's Picks

EUR/USD challenges 1.1700, six-week lows

EUR/USD remains under heavy downside pressire in quite a dfrreadful start to the new trading week, putting the 1.1700 support to the test amid the marked rebound in the US Dollar. The flight-so-safety environment continues to support the Greenback following the escalating conflict in the Middle East.

GBP/USD hits new yearly lows near 1.3300

GBP/USD adds to the recent bearish tone, approaching to the key 1.3300 support to reach fresh YTD troughs against the backdrop of the robust performance of the US Dollar. Indeed, Cable’s decline comes amid the firm demand for the safe-haven space in the wake of the US and Israel attacks to Iran.

Gold shifts its attention to $5,600 on fligh-to-safety mood

Gold climbs to levels last seen in late January past the $5,400 mark per troy ounce on Monday. The yellow metal’s strong uptick remains fuelled by incresing geopolitical tensions in the Middle East and the consequent demand for safer assets.

Bitcoin on brink of breakdown amid US-Iran war

Bitcoin (BTC) remains under pressure near the key support level of $65,700. Trading at $66,400 at the time of writing on Monday, a breakdown below this critical level would suggest a deeper correction ahead.

The week ahead: Conflict in the Middle East jolts markets

Events in the Middle East are obviously dominating financial markets this morning. The Brent crude oil price is extending gains and is higher by more than 8%, stock futures are pointing lower and the gold price is higher by more than 2%. 

Pi Network Price Forecast: Core team offloads supply, weighing on PI recovery

Pi Network  hovers below $0.1700, broadly steady at press time on Monday, attempting a recovery after a 2% loss the previous day. Sunday’s decline aligned with nearly 49 million PI tokens offloaded by the Pi Foundation, implying a spike in supply pressure that capped the prevailing four-day recovery.