Silver Price Analysis: XAG/USD skyrockets over 2% amid ‘double bottom’ confirmation
- Silver breaks $30.73 neckline, surges past $31.00 to trade at $31.40.
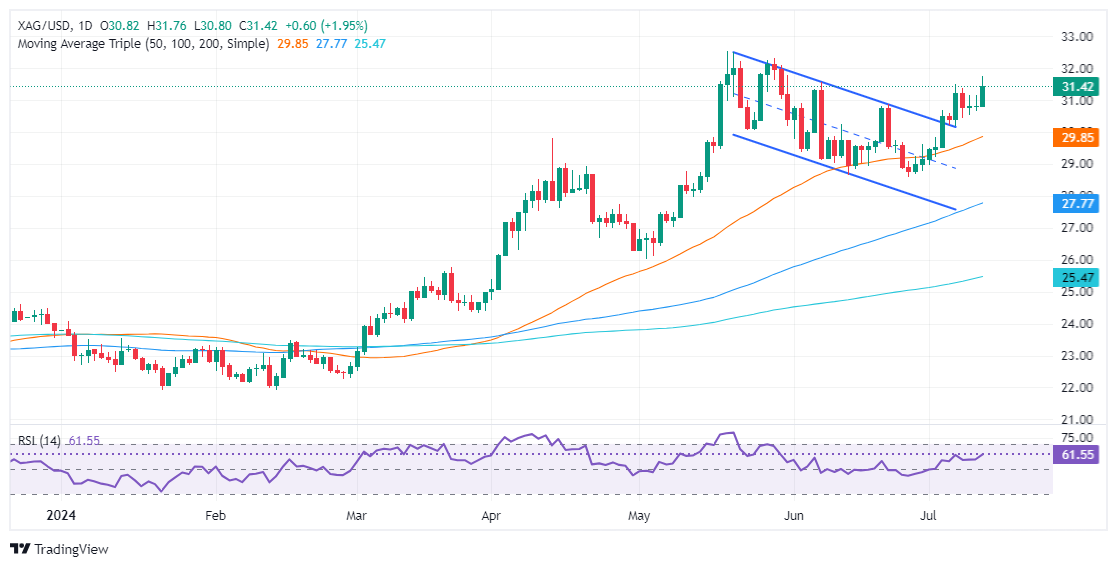
- Bullish momentum affirmed by RSI, with resistance at $31.75, $32.00, and $32.51 (YTD high).
- Key support levels: $31.00, $30.73 (June 21 high), and $29.82/79 (50-DMA) for potential pullbacks.

Silver price confirmed a ‘double bottom’ chart pattern, sponsored by weaker than expected US inflation data, that puts back into the table discussion about when the Federal Reserve would begin to ease monetary policy. Therefore, the XAG/USD trades at $31.40, moving up more than 2%.
XAG/USD Price Analysis: Technical outlook
The grey metal finally cleared the ‘double bottom’ neckline at $30.73, which opened the door for Thursday’s rally above the $31.00 figure. It hit a six-week high of $31.75 before settling at around current spot prices.
Momentum shows buyers are regaining control, as depicted in the Relative Strength Index (RSI). This opens the door for further upside in the XAG/USD.
Silver’s next resistance would be $31.75, followed by the $32.00 psychological figures. Once surpassed, the May 29 peak of $32.15 emerges, ahead of the year-to-date (YTD) high at $32.51. Further gains are seen above the latter.
Conversely, if XAG/USD spot price tumbles beneath $31.00, that could exacerbate a pullback. The next demand zone will be the June 21 high at $30.73, followed by the $30.00 mark. Up next, sellers will test the confluence of the April 12 high and the 50-day moving average (DMA) at $29.82/79.
XAG/USD Price Action – Daily Chart
Silver FAQs
Silver is a precious metal highly traded among investors. It has been historically used as a store of value and a medium of exchange. Although less popular than Gold, traders may turn to Silver to diversify their investment portfolio, for its intrinsic value or as a potential hedge during high-inflation periods. Investors can buy physical Silver, in coins or in bars, or trade it through vehicles such as Exchange Traded Funds, which track its price on international markets.
Silver prices can move due to a wide range of factors. Geopolitical instability or fears of a deep recession can make Silver price escalate due to its safe-haven status, although to a lesser extent than Gold's. As a yieldless asset, Silver tends to rise with lower interest rates. Its moves also depend on how the US Dollar (USD) behaves as the asset is priced in dollars (XAG/USD). A strong Dollar tends to keep the price of Silver at bay, whereas a weaker Dollar is likely to propel prices up. Other factors such as investment demand, mining supply – Silver is much more abundant than Gold – and recycling rates can also affect prices.
Silver is widely used in industry, particularly in sectors such as electronics or solar energy, as it has one of the highest electric conductivity of all metals – more than Copper and Gold. A surge in demand can increase prices, while a decline tends to lower them. Dynamics in the US, Chinese and Indian economies can also contribute to price swings: for the US and particularly China, their big industrial sectors use Silver in various processes; in India, consumers’ demand for the precious metal for jewellery also plays a key role in setting prices.
Silver prices tend to follow Gold's moves. When Gold prices rise, Silver typically follows suit, as their status as safe-haven assets is similar. The Gold/Silver ratio, which shows the number of ounces of Silver needed to equal the value of one ounce of Gold, may help to determine the relative valuation between both metals. Some investors may consider a high ratio as an indicator that Silver is undervalued, or Gold is overvalued. On the contrary, a low ratio might suggest that Gold is undervalued relative to Silver.
Author

Christian Borjon Valencia
FXStreet
Markets analyst, news editor, and trading instructor with over 14 years of experience across FX, commodities, US equity indices, and global macro markets.


