|

Silver Price Analysis: XAG/USD sits near two-week high, 200-day SMA holds the key for bulls

  • Silver attracts some dip-buying on Tuesday and climbs back to a nearly two-week top.
  • The mixed technical setup warrants caution before placing aggressive directional bets.
  • The 200-day SMA is likely to keep a lid on any further gains and act as a pivotal point.

Silver reverses modest intraday losses to the $23.15 area and climbs back closer to a nearly two-week high touched this Tuesday. The white metal now trades around the $23.25 region during the early European session, nearly unchanged for the day.

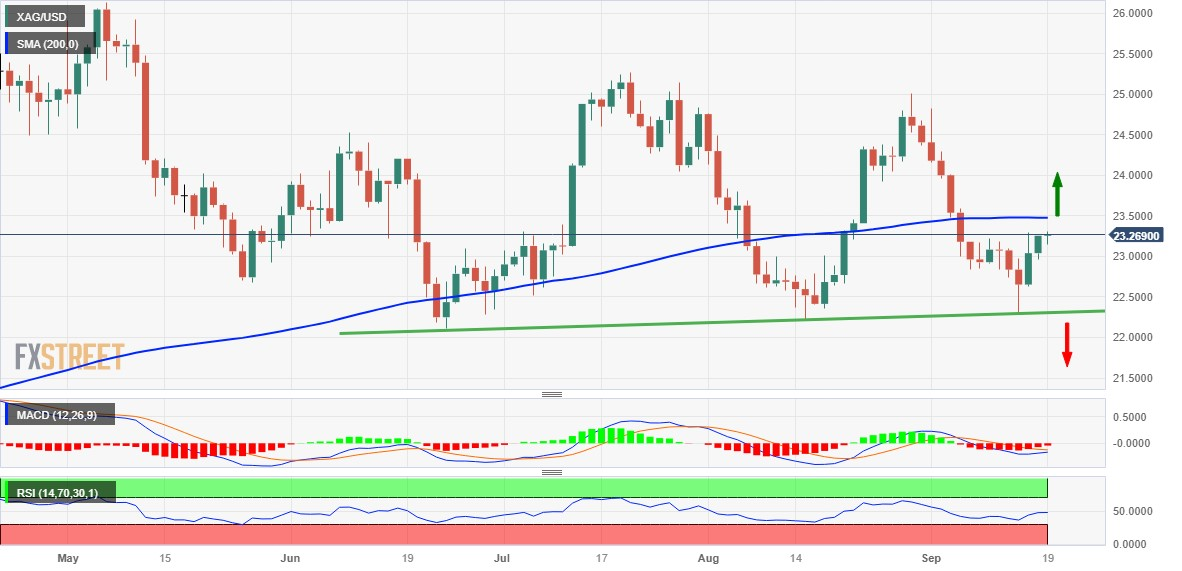
From a technical perspective, oscillators on the daily chart – though have been recovering from lower levels – are still holding in the negative territory and favour bearish traders. That said, last week's solid bounce from the $22.30 support area – representing an ascending trend line extending from the June monthly low – and the subsequent strength warrants caution before positioning for deeper losses ahead of the pivotal FOMC monetary policy decision on Wednesday.

In the meantime, any meaningful decline is likely to find some support near the $23.00 round figure ahead of the $22.80 area and the $23.30 region or a nearly one-month low touched last Thursday. A convincing break below the latter will be seen as a fresh trigger for bearish traders and make the XAG/USD vulnerable to accelerate the fall towards the next relevant support near the $21.25 zone. The downward trajectory could get extended further towards the $21.00 mark.

On the flip side, momentum beyond the $23.30 area, or the daily peak, could face stiff resistance and remain capped near a technically significant 200-day Simple Moving Average (SMA), currently pegged around the $23.45 region. A sustained breakout, however, could shift the bias in favour of bullish traders. This, in turn, should allow the XAG/USD to climb further beyond the 100-day SMA barrier near the $23.80 region and aim to reclaim the $24.00 round-figure mark.

The next relevant hurdle is pegged near the $24.30-$24.35 region, above which the XAG/USD is likely to conquer the $25.00 psychological mark. The latter coincides with the August monthly swing high and is closely followed by the July peak, around the $25.25 region.

Silver daily chart

fxsoriginal

Technical levels to watch

XAG/USD

Overview
Today last price23.21
Today Daily Change-0.05
Today Daily Change %-0.21
Today daily open23.26
 
Trends
Daily SMA2023.64
Daily SMA5023.74
Daily SMA10023.72
Daily SMA20023.48
 
Levels
Previous Daily High23.26
Previous Daily Low22.96
Previous Weekly High23.29
Previous Weekly Low22.3
Previous Monthly High25.02
Previous Monthly Low22.23
Daily Fibonacci 38.2%23.15
Daily Fibonacci 61.8%23.08
Daily Pivot Point S123.06
Daily Pivot Point S222.86
Daily Pivot Point S322.76
Daily Pivot Point R123.36
Daily Pivot Point R223.46
Daily Pivot Point R323.65

Author

Haresh Menghani

Haresh Menghani is a detail-oriented professional with 10+ years of extensive experience in analysing the global financial markets.

More from Haresh Menghani
Share:

Markets move fast. We move first.

Orange Juice Newsletter brings you expert driven insights - not headlines. Every day on your inbox.

By subscribing you agree to our Terms and conditions.

Editor's Picks

EUR/USD edges above 1.1750 due to ECB-Fed policy divergence

EUR/USD has recovered its recent losses registered in the previous session, trading around 1.1760 during the Asian hours on Friday. Traders will likely observe Germany’s Manufacturing Purchasing Managers’ Index data later in the day.

GBP/USD gathers strength above 1.3450 on Fed rate cut bets, BoE's gradual policy path

The GBP/USD pair gathers strength to around 1.3480 during the early Asian session on Friday. Expectations of the US Federal Reserve rate cuts this year weigh on the US Dollar against the Pound Sterling. Philadelphia Fed President Anna Paulson is set to speak later on the weekend. 

Gold climbs to near $4,350 on Fed rate cut bets, geopolitical risks

Gold price rises to near $4,345 during the early Asian session on Friday. Gold finished 2025 with a significant rally, achieving an annual gain of around 65%, its biggest annual gain since 1979. The rally of the precious metal is bolstered by the prospect of further US interest rate cuts in 2026 and safe-haven flows.

Bitcoin trades in compression as 2026 begins with structure still unresolved

BTC/USD remains locked in a two-way structure, with micro supply-and-demand levels guiding early-year price behaviour.

Economic outlook 2026-2027 in advanced countries: Solidity test

After a year marked by global economic resilience and ending on a note of optimism, 2026 looks promising and could be a year of solid economic performance. In our baseline scenario, we expect most of the supportive factors at work in 2025 to continue to play a role in 2026.

Crypto market outlook for 2026

Year 2025 was volatile, as crypto often is.  Among positive catalysts were favourable regulatory changes in the U.S., rise of Digital Asset Treasuries (DAT), adoption of AI and tokenization of Real-World-Assets (RWA).