Silver Price Analysis: XAG/USD sellers approach $20.20 support confluence


  • Silver price holds lower ground near the short-term key support comprising 50-day EMA, three-week-old ascending support line.
  • Receding bullish MACD signals, sustained pullback from 61.8% Fibonacci retracement tease sellers.
  • Bulls need validation from $21.00 to retake control.

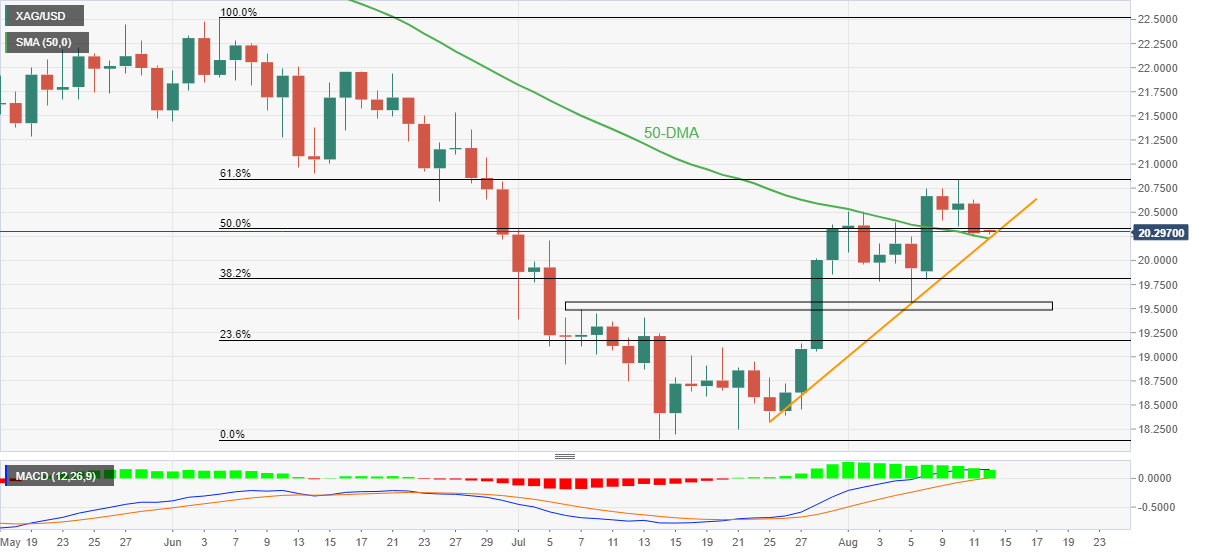
Silver price (XAG/USD) remains pressured at around $20.30, keeping the previous day’s bearish bias during Friday’s Asian session. In doing so, the bright metal holds on to the latest downside break of the 50% Fibonacci retracement level of the June-July fall amid recently easing bullish signals of the MACD.

That said, the quote’s U-turn from the 61.8% Fibonacci retracement level earlier in the week also keeps XAG/USD sellers hopeful to conquer the $20.20 support confluence including the 50-DMA and an upward sloping trend line from July 25.

It’s worth noting that the silver sellers might search for the daily closing below the $20.00 threshold to validate the weakness past $20.20.

Following that, a south-run towards the five-week-long horizontal area near $19.55-45 can’t be ruled out.

Meanwhile, the 50% and the 61.8% Fibonacci retracement levels, respectively near $20.35 and $20.85 could restrict short-term upside moves of the silver price.

Should the quote manage to cross the $20.85 hurdle, the mid-June swing low near $21.00 will act as an extra filter to the north before directing the XAG/USD buyers towards the June 27 peak of $21.53.

Silver: Daily chart

Trend: Further weakness expected

Additional important levels

Overview
Today last price 20.29
Today Daily Change -0.30
Today Daily Change % -1.46%
Today daily open 20.59
 
Trends
Daily SMA20 19.47
Daily SMA50 20.3
Daily SMA100 21.84
Daily SMA200 22.75
 
Levels
Previous Daily High 20.84
Previous Daily Low 20.35
Previous Weekly High 20.51
Previous Weekly Low 19.55
Previous Monthly High 20.37
Previous Monthly Low 18.15
Daily Fibonacci 38.2% 20.65
Daily Fibonacci 61.8% 20.54
Daily Pivot Point S1 20.34
Daily Pivot Point S2 20.1
Daily Pivot Point S3 19.85
Daily Pivot Point R1 20.84
Daily Pivot Point R2 21.09
Daily Pivot Point R3 21.33


Share: Feed news

Information on these pages contains forward-looking statements that involve risks and uncertainties. Markets and instruments profiled on this page are for informational purposes only and should not in any way come across as a recommendation to buy or sell in these assets. You should do your own thorough research before making any investment decisions. FXStreet does not in any way guarantee that this information is free from mistakes, errors, or material misstatements. It also does not guarantee that this information is of a timely nature. Investing in Open Markets involves a great deal of risk, including the loss of all or a portion of your investment, as well as emotional distress. All risks, losses and costs associated with investing, including total loss of principal, are your responsibility. The views and opinions expressed in this article are those of the authors and do not necessarily reflect the official policy or position of FXStreet nor its advertisers. The author will not be held responsible for information that is found at the end of links posted on this page.

If not otherwise explicitly mentioned in the body of the article, at the time of writing, the author has no position in any stock mentioned in this article and no business relationship with any company mentioned. The author has not received compensation for writing this article, other than from FXStreet.

FXStreet and the author do not provide personalized recommendations. The author makes no representations as to the accuracy, completeness, or suitability of this information. FXStreet and the author will not be liable for any errors, omissions or any losses, injuries or damages arising from this information and its display or use. Errors and omissions excepted.

The author and FXStreet are not registered investment advisors and nothing in this article is intended to be investment advice.

Recommended content


Recommended content

Editors’ Picks

EUR/USD climbs to 10-day highs above 1.0700

EUR/USD climbs to 10-day highs above 1.0700

EUR/USD gained traction and rose to its highest level in over a week above 1.0700 in the American session on Tuesday. The renewed US Dollar weakness following the disappointing PMI data helps the pair stretch higher.

EUR/USD News

GBP/USD extends recovery beyond 1.2400 on broad USD weakness

GBP/USD extends recovery beyond 1.2400 on broad USD weakness

GBP/USD gathered bullish momentum and extended its daily rebound toward 1.2450 in the second half of the day. The US Dollar came under heavy selling pressure after weaker-than-forecast PMI data and fueled the pair's rally. 

GBP/USD News

Gold rebounds to $2,320 as US yields turn south

Gold rebounds to $2,320 as US yields turn south

Gold reversed its direction and rose to the $2,320 area, erasing a large portion of its daily losses in the process. The benchmark 10-year US Treasury bond yield stays in the red below 4.6% following the weak US PMI data and supports XAU/USD.

Gold News

Here’s why Ondo price hit new ATH amid bearish market outlook Premium

Here’s why Ondo price hit new ATH amid bearish market outlook

Ondo price shows no signs of slowing down after setting up an all-time high (ATH) at $1.05 on March 31. This development is likely to be followed by a correction and ATH but not necessarily in that order.

Read more

Germany’s economic come back

Germany’s economic come back

Germany is the sick man of Europe no more. Thanks to its service sector, it now appears that it will exit recession, and the economic future could be bright. The PMI data for April surprised on the upside for Germany, led by the service sector.

Read more

Forex MAJORS

Cryptocurrencies

Signatures