|

Silver Price Analysis: XAG/USD seems vulnerable, bears await break below 38.2% Fibo.

  • Silver drops to a multi-week low, though finds some support near the 38.2% Fibo. level.
  • The technical setup favours bearish traders and supports prospects for deeper losses.
  • A sustained strength beyond the $24.20-30 area is needed to negate the negative bias.

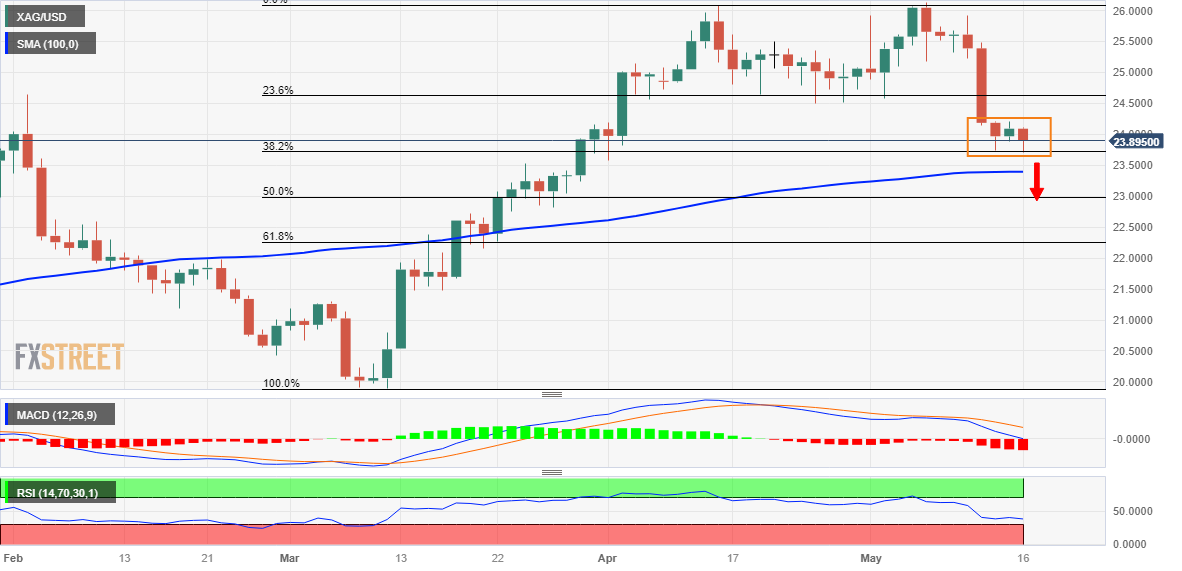
Silver comes under some renewed selling pressure following the previous day's modest uptick and drops to its lowest level since April 3 during the first half of trading on Tuesday. The white metal, however, finds some support near the 38.2% Fibonacci retracement level of the March-May rise and trades just below the $24.00 mark during the early European session, still down 0.80% for the day.

From a technical perspective, the two-way price move witnessed over the past three days constitutes the formation of a rectangle on hourly charts. Against the backdrop of the recent sharp pullback from over a one-year top, this might still be categorized as a bearish consolidation phase. Moreover, oscillators on hourly/daily charts are holding deep in the negative territory and support prospects for further losses.

That said, it will still be prudent to wait for a sustained break below the $23.70-$23.65 area (38.2% Fibo.) before positioning for an extension of over a one-week-old downtrend. The XAG/USD might then test the $23.40 strong horizontal support, which coincides with the 100-day Simple Moving Average (SMA). The latter should act as a pivotal point to determine the near-term trajectory. 

The subsequent downfall could drag the XAG/USD towards 50% Fibo. level, around the $23.00 round-figure mark. The next relevant support is pegged near the $22.65-$22.60 region ahead of the $22.30-$22.25 zone, or the 61.8% Fibo. level. A convincing break below the latter will be seen as a fresh trigger for bearish traders and pave the way for a further depreciating move.

On the flip side, the top end of a short-term trading range, around the $24.15-$24.20 region, could act as an immediate hurdle. A sustained strength beyond might trigger a short-covering rally and lift the XAG/USD towards the 23.6% Fibo. level, around the $24.60 zone. Some follow-through buying should allow bulls to reclaim the $25.00 psychological mark and aim to test the next resistance near the $25.30-$25.40 supply zone.

Silver daily chart
fxsoriginal

Key levels to watch

XAG/USD

Overview
Today last price23.9
Today Daily Change-0.19
Today Daily Change %-0.79
Today daily open24.09
 
Trends
Daily SMA2025.12
Daily SMA5023.93
Daily SMA10023.39
Daily SMA20021.87
 
Levels
Previous Daily High24.21
Previous Daily Low23.88
Previous Weekly High25.92
Previous Weekly Low23.74
Previous Monthly High26.09
Previous Monthly Low23.57
Daily Fibonacci 38.2%24.08
Daily Fibonacci 61.8%24.01
Daily Pivot Point S123.91
Daily Pivot Point S223.73
Daily Pivot Point S323.58
Daily Pivot Point R124.24
Daily Pivot Point R224.39
Daily Pivot Point R324.57

Author

Haresh Menghani

Haresh Menghani is a detail-oriented professional with 10+ years of extensive experience in analysing the global financial markets.


More from Haresh Menghani
Share:

Editor's Picks

GBP/USD keeps the bid bias near 1.3550

GBP/USD leaves behind part of the recent three-day retracement and hovers around the 1.3550 region on Monday. The Greenback’s fresh downward trend helps Cable and the rest of the risk complex recoup part of the recent ground lost while attention remains on the potential Fed rate path.

EUR/USD retakes 1.1600; looks at the 200-day SMA

EUR/USD manages to gather fresh steam and advances past the 1.1600 hurdle as Monday’s NA session draws to a close. Indeed, the pair patially reverses Friday’s sharp retracement amid the renewed downside momentum in the US Dollar. Moving forward, the flash Inflation Rate in the euro zone and US JOLTs and the ISM Manufacturing should keep investors entertained on turnaround Tuesday.

Gold: Is the bullish run over?

Gold adds to Friday’s marked decline, although it has managed to bounce off earlier lows in the sub-$4,400 region per troy ounce on Monday. The yellow metal’s pullback comes despite the softer stance in the US Dollar and steady uncertainty in the Middle East, although rising yields keep bulls at bay for now.

Bitcoin and Gold Outlook: BTC clings to support, XAU slides as US-Iran tensions re-escalate
Bitcoin (BTC) maintains stability above $78,000 support on Monday as crypto prices broadly consolidate. Gold (XAU/USD), meanwhile, holds above $4,400, marking two consecutive days of declines. Sentiment in the broader cryptocurrency market remains broadly positive, with the Fear & Greed Index holding at 62 on Monday, down slightly from 69 the previous day.
Oil rallies on fresh persian gulf strikes
Energy prices are trading firmer this morning after the US carried out targeted strikes against Iran, drawing retaliatory strikes and reinforcing concerns about a prolonged stalemate in the Persian Gulf. Oil prices started the week stronger following the first military strikes between the US and Iran in a month. ICE Brent briefly moved back above US$90/bbl in early morning Asia trading.
Diesel’s record $100 warning: The oil shock hiding in plain sight

The Oil market may look calmer than it did a few months ago, but diesel is sending a very different message. The US diesel crack spread, the premium of ultra-low sulphur diesel futures over WTI, recently surged above $100 per barrel for the first time, reaching an intraday record of just over $102.00.














