|

Silver Price Analysis: XAG/USD retreats towards $25.00 but bulls keep reins

  • Silver pares weekly gains after two-day downtrend but stays above key supports.
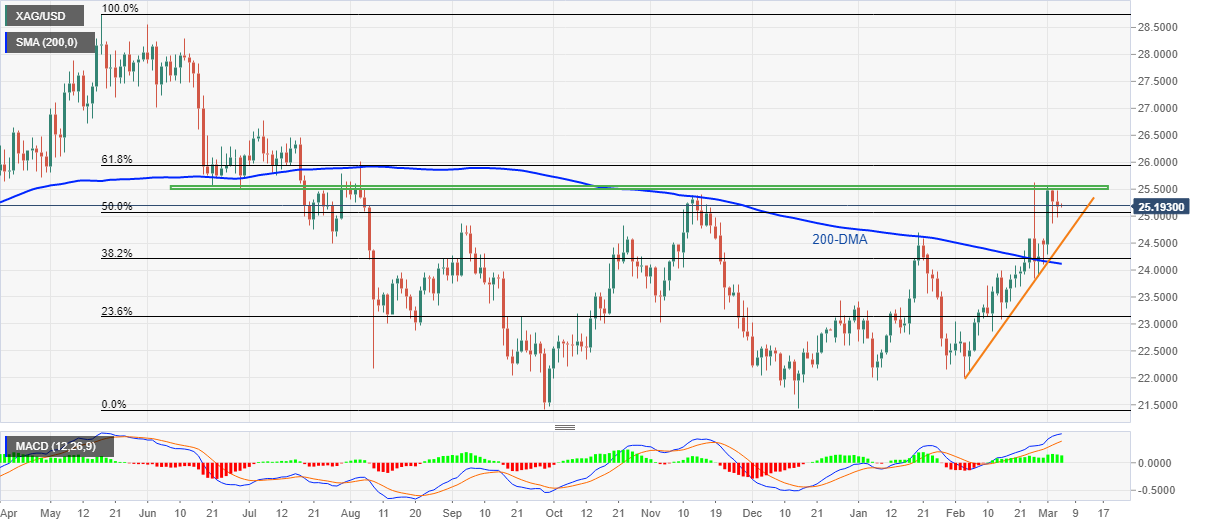
  • One-month-old ascending trend line, 200-DMA restricts short-term downside.
  • Horizontal area from June, 61.8% Fibonacci retracement challenge buyers.
  • MACD, sustained trading beyond the key levels keep buyers hopeful.

Silver (XAG/USD) remains pressured towards $25.00 amid the early Asian session on Friday, after a two-day losing streak.

Even so, the metal buyers stay positive as MACD flashes bullish signals as the prices are way beyond the short-term key supports.

That said, the latest pullback from a horizontal area from June 21, 2021, around $25.50-55, directs the silver sellers towards a 50% Fibonacci retracement (Fibo.) level of May-September 2021 downside near $25.00.

However, an upward sloping support line from early February and the 200-DMA, respectively around $24.50 and $24.10, will challenge XAG/USD downside afterward.

In a case where silver prices drop below $24.10, odds of witnessing further declines towards the latest 2021 peak near $23.40 and then to the $23.00 threshold can’t be ruled out.

Alternatively, recovery moves need to cross the immediate horizontal area near $25.50-55 before challenging the 61.8% Fibo. level close to $26.00.

Following that, July 2021 high near $26.80 should lure the silver buyers.

Silver: Daily chart

Trend: Further upside expected

Additional important levels 

Overview
Today last price25.18
Today Daily Change-0.09
Today Daily Change %-0.36%
Today daily open25.27
 
Trends
Daily SMA2023.81
Daily SMA5023.37
Daily SMA10023.44
Daily SMA20024.14
 
Levels
Previous Daily High25.52
Previous Daily Low24.86
Previous Weekly High25.62
Previous Weekly Low23.7
Previous Monthly High25.62
Previous Monthly Low22.01
Daily Fibonacci 38.2%25.11
Daily Fibonacci 61.8%25.27
Daily Pivot Point S124.91
Daily Pivot Point S224.56
Daily Pivot Point S324.25
Daily Pivot Point R125.57
Daily Pivot Point R225.88
Daily Pivot Point R326.23

Author

Anil Panchal

Anil Panchal

FXStreet

Anil Panchal has nearly 15 years of experience in tracking financial markets. With a keen interest in macroeconomics, Anil aptly tracks global news/updates and stays well-informed about the global financial moves and their implications.

More from Anil Panchal
Share:

Editor's Picks

AUD/USD eyes 0.7150 barrier nine-day EMA

AUD/USD inches higher after registering modest losses in the previous day, trading around 0.7130 during the Asian hours. The technical analysis of the daily chart indicates that the pair is moving sideways within the rectangle pattern, suggesting a consolidation as neither the bulls nor the bears have enough momentum to take control of the market.

USD/JPY trades below 160.00 intervention threshold; bullish bias intact

The USD/JPY pair attracts some sellers during the Asian session amid fears that authorities will step in again to prop up the Japanese Yen. Furthermore, the Israel-Lebanon truce prompts some profit-taking around the US Dollar and exerts downward pressure on the currency pair.

Gold extends rebound to $4,500 as US yields edge lower

Gold (XAU/USD) preserves its recovery momentum following Wednesday's slide and tests the $4,500 mark in the second half of the day on Thursday. While US-Iran uncertainty remains, easing tensions between Lebanon on Israel seems to be helping the market mood improve, causing the USD to lose strength alongside falling US T-bond yields and opening the door for a decisive rebound in XAU/USD.

Bitcoin’s massive storm is back: Why the sell-off is far from over

Bitcoin price action over the last few weeks has felt less like a normal, healthy correction and more like a slow grinding crash that continues to wreak havoc on holdings and trading accounts. And everything suggests that the dramatic crash isn’t over.

Nonfarm payrolls: Testing the limits of Fed policy patience

The upcoming nonfarm payrolls report for May will provide the final update on the US labor market before Kevin Warsh attends his first policy meeting as the new Fed Chair later this month.

Recession on paper: What really moves the Canadian Loonie now?

Statistics Canada handed the headline writers a gift and the analysts a headache. Real GDP shrank 0.1% on an annualized basis in the first quarter, and with the fourth quarter of 2025 revised down to a 1.0% contraction, that is two negative quarters in a row, the textbook definition of a technical recession and Canada's first since the pandemic.