|

Silver Price Analysis: XAG/USD retreats from multi-week top, holds above $24.00 mark

  • Silver edges lower on Monday and corrects further from over a three-month high.
  • The 200-period SMA on the 4-hour chart to act as a pivotal point and limit losses.
  • Bulls might wait for a move beyond the $24.35-40 area before placing fresh bets.

Silver attracts some intraday selling on the first day of a new week and moves away from over a three-week high, around the $24.35-$24.40 region touched on Friday. The white metal sticks to a mildly negative tone through the early part of the European session, albeit manages to hold its neck above the $24.00 round-figure mark.

Any subsequent slide below the aforementioned handle is more likely to find some support near the $23.85-$23.80 area, or the 200-period Simple Moving Average (SMA) on the 4-hour chart. Against the backdrop of positive technical indicators on 4-hour/daily charts, the said area could act as a pivotal point for intraday traders and help limit any further decline.

Silver 4-hour chart

fxsoriginal

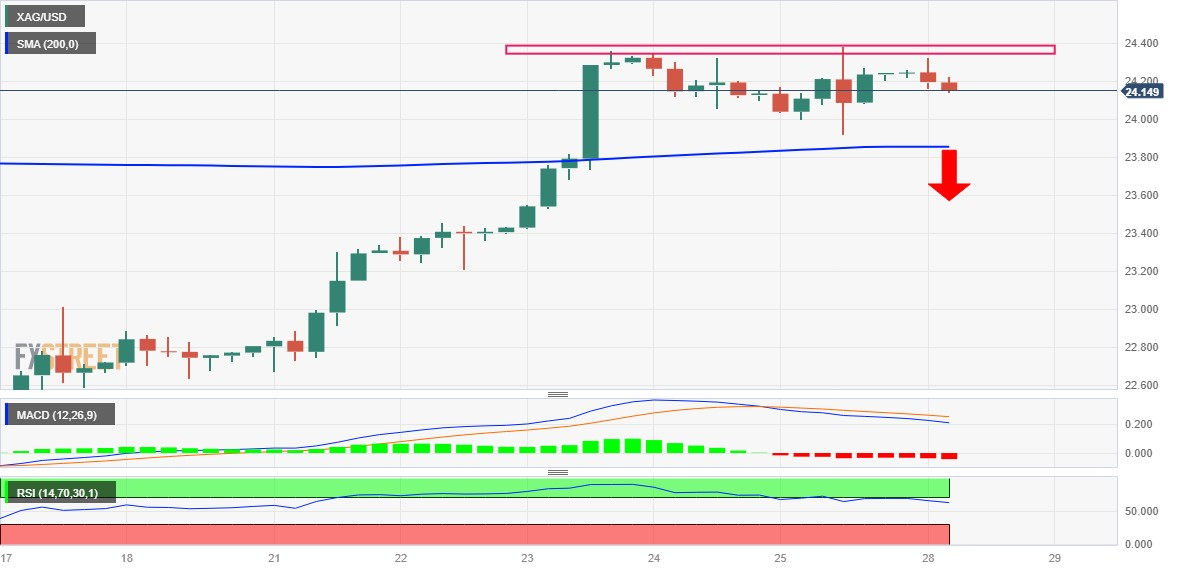
A sustained break below, however, might prompt some technical selling and drag the XAG/USD towards the $23.55 region. This is closely followed by support near the $23.40 area, representing the 200-day SMA, which if broken decisively might shift the near-term bias in favour of bearish traders and pave the way for some meaningful downside.

On the flip side, the $24.35-$24.40 area might continue to act as an immediate strong resistance, which if cleared should allow the XAG/USD to surpass the $24.55-$24.60 intermediate hurdle and aim to reclaim the $25.00 psychological mark. The positive move could get extended further towards the $25.25 zone, or the July monthly swing high, en route to the $26.00 mark.

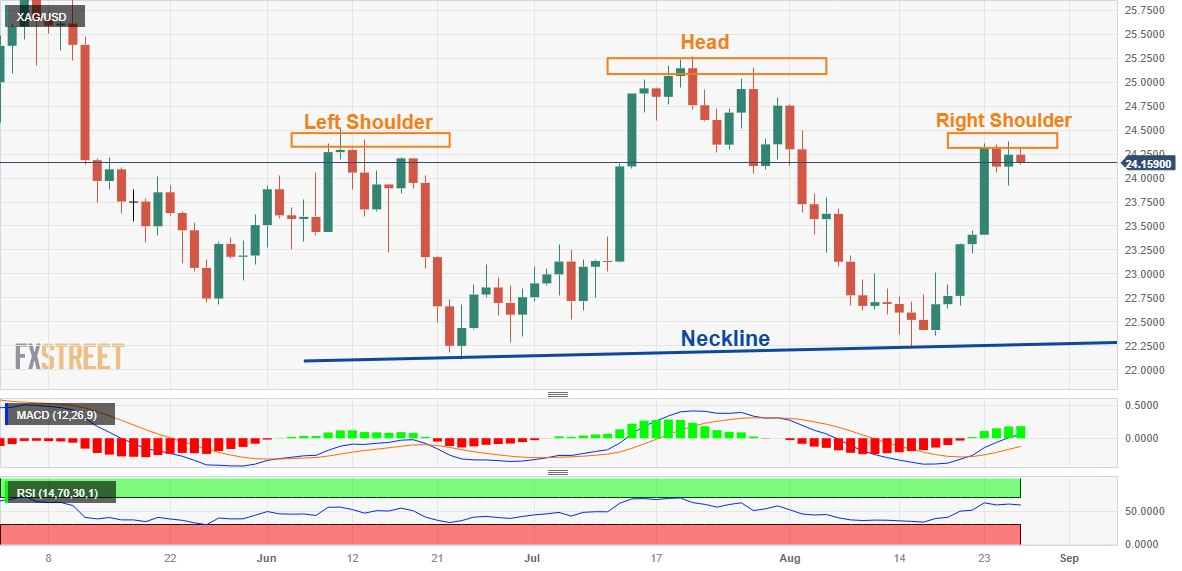
Zooming out to the daily chart, the recent price action witnessed since early June seems to constitute the formation of a bearish head and shoulders pattern on the daily chart. The pattern, however, will be confirmed on a sustained break below the neckline support, around the $22.20-$22.10 region.

XAG/USD daily chart

fxsoriginal

Key levels to watch

XAG/USD

Overview
Today last price24.15
Today Daily Change-0.09
Today Daily Change %-0.37
Today daily open24.24
 
Trends
Daily SMA2023.32
Daily SMA5023.53
Daily SMA10023.98
Daily SMA20023.35
 
Levels
Previous Daily High24.38
Previous Daily Low23.92
Previous Weekly High24.38
Previous Weekly Low22.67
Previous Monthly High25.27
Previous Monthly Low22.52
Daily Fibonacci 38.2%24.21
Daily Fibonacci 61.8%24.1
Daily Pivot Point S123.98
Daily Pivot Point S223.72
Daily Pivot Point S323.51
Daily Pivot Point R124.45
Daily Pivot Point R224.65
Daily Pivot Point R324.91

Author

Haresh Menghani

Haresh Menghani is a detail-oriented professional with 10+ years of extensive experience in analysing the global financial markets.

More from Haresh Menghani
Share:

Editor's Picks

GBP/USD bounces off lows, back above 1.3200

After bottoming out near 1.3160, GBP/USD manages to regain a bit of shine and reclaim the 1.3200 mark and beyond at the end of the week. Stronger-than-expected UK Retail Sales data seem to be helping the British Pound limit its losses, while the chaotic UK political environment keeps the bulls at bay for now.

EUR/USD looks consolidative around 1.1460

EUR/USD stages a modest rebound after slipping to a three-month low below 1.1420 at the end of the week. That said, the pair now looks to consolidate humble gains just above 1.1460 despite growing uncertainty surrounding the next round of US-Iran negotiations, which keeps the US Dollar’s downside contained.

Gold slips back to six-day lows, targets $4,100

Gold retreats for the third consecutive day on Friday, eroding gains seen in the first half of the week and approaching the key $4,100 mark per troy ounce. Indeed, the precious metal continues to face headwinds from the Fed's hawkish stance and renewed uncertainty surrounding the next round of US-Iran negotiations.

Solana extends correction despite ETF inflows, RWA adoption

Solana (SOL) price edges below $70 extending its losses for the fourth straight day this week. The institutional demand for Solana is building, with steady inflows so far this week and Morgan Stanley’s amended S-1 filing for a Solana-focused Exchange-Traded Fund.

The Iran war didn't break the US economy, but what happens next?

Nearly four months after the start of the Iran war, the US economy remains remarkably resilient. While the conflict initially triggered a severe disruption to global energy markets and a sharp rise in Oil prices, recent diplomatic progress between Washington and Tehran has eased concerns about a prolonged supply shock.

Regime change: Inside Kevin Warsh's first move to make the Fed unreadable on purpose

The rate did not move. That was the least interesting thing about Kevin Warsh's first meeting in charge of the Fed. The FOMC held its benchmark at 3.50%-3.75% for the fourth straight meeting, exactly as priced, and then the new chair used his first press conference to dismantle the machinery the market has leaned on for a decade.