|

Silver Price Analysis: XAG/USD remains below 200-day SMA/61.8% Fibo. confluence

  • Silver climbs to a one-week high on Monday, albeit struggles to capitalize on the move up.
  • The technical setup seems tilted in favour of bulls and supports prospects for further gains.
  • A sustained move beyond the $23.30-40 confluence is needed to reaffirm the positive bias.

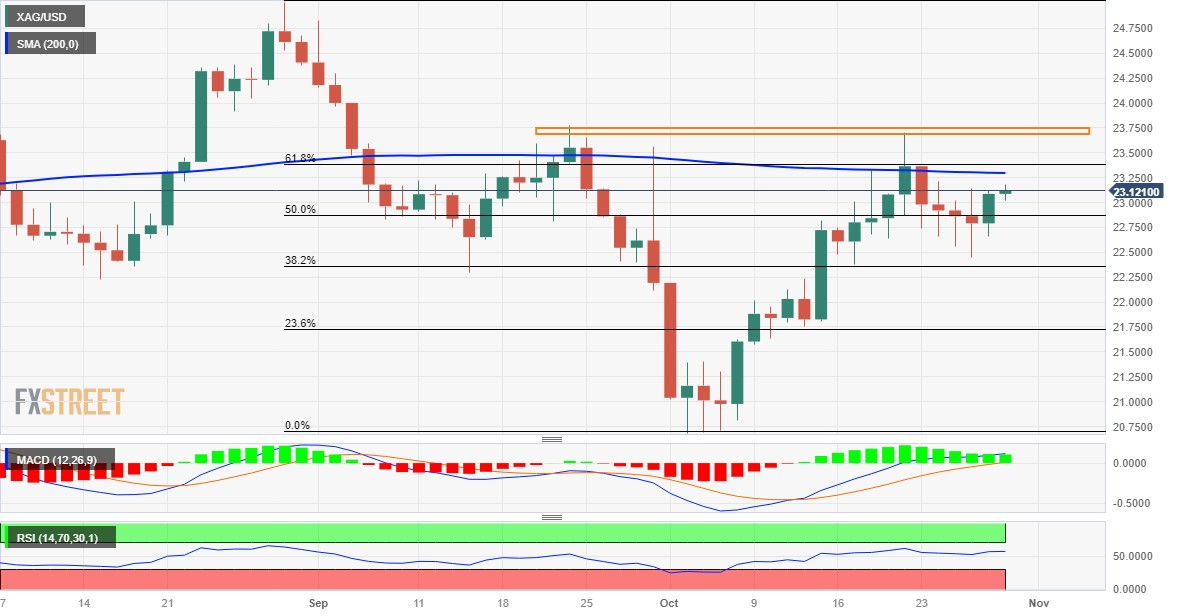
Silver (XAG/USD) gains some positive traction for the second successive day and touches a one-week high, around the $23.20 area during the Asian session on Monday. The white metal, however, struggles to capitalize on the move and remains below the $23.30-$23.40 confluence, comprising the 200-day Simple Moving Average (SMA) and the 61.8% Fibonacci retracement level of the August-October downfall.

The aforementioned hurdle is followed by the $23.70-$23.75 supply zone, which should now act as a key pivotal point. Technical indicators on the daily chart, meanwhile, have been gaining positive traction and are still far from being in the overbought zone. Hence, a sustained strength beyond the said barriers will be seen as a fresh trigger for the XAG/USD bulls and pave the way for some meaningful appreciating move.

The subsequent move up could get extended beyond the $24.00 round-figure mark, towards testing the next relevant resistance near the $24.20 region. Some follow-through buying will confirm a fresh breakout and allow the XAG/USD to make a fresh attempt towards conquering the $25.00 psychological mark.

On the flip side, slide back below the $23.00 round figure now seems to find some support near the $22.85 region, or the 50% Fibo. level. The next relevant support is pegged near last week's swing low, around the $22.55 area, ahead of the 38.2% Fibo. level, around the $22.35-$22.30 static support. Failure to defend the said support levels might shift the bias in favour of the XAG/USD bears.

The downward trajectory could then get extended further towards the $22.00 round-figure mark, en route to the $21.70 region, representing 23.6% Fibo. level. Some follow-through selling could make the XAG/USD vulnerable to accelerate the fall further towards the $21.00 level before eventually dropping to the $20.70-$20.65 region, or its lowest level since March touched earlier this month.

Silver daily chart

fxsoriginal

Technical levels to watch

XAG/USD

Overview
Today last price23.12
Today Daily Change0.03
Today Daily Change %0.13
Today daily open23.09
 
Trends
Daily SMA2022.27
Daily SMA5022.97
Daily SMA10023.25
Daily SMA20023.3
 
Levels
Previous Daily High23.13
Previous Daily Low22.66
Previous Weekly High23.36
Previous Weekly Low22.44
Previous Monthly High24.82
Previous Monthly Low22.12
Daily Fibonacci 38.2%22.95
Daily Fibonacci 61.8%22.84
Daily Pivot Point S122.79
Daily Pivot Point S222.49
Daily Pivot Point S322.33
Daily Pivot Point R123.25
Daily Pivot Point R223.42
Daily Pivot Point R323.72

Author

Haresh Menghani

Haresh Menghani is a detail-oriented professional with 10+ years of extensive experience in analysing the global financial markets.

More from Haresh Menghani
Share:

Markets move fast. We move first.

Orange Juice Newsletter brings you expert driven insights - not headlines. Every day on your inbox.

By subscribing you agree to our Terms and conditions.

Editor's Picks

EUR/USD recovers to 1.1750 region as 2025 draws to a close

Following the bearish action seen in the European session on Wednesday, EUR/USD regains its traction and recovery to the 1.1750 region. Nevertheless, the pair's volatility remains low as trading conditions thin out on the last day of the year.

GBP/USD stays weak near 1.3450 on modest USD recovery

GBP/USD remains under modest beairsh pressure and fluctuates at around 1.3450 on Wednesday. The US Dollar finds fresh demand due to the end-of-the-year position adjustments, weighing on the pair amid the pre-New Year trading lull. 

Gold retreats to $4,300 area, looks to post monthly gains

Gold stays on the back foot on the last day of 2025 and trades near $4,300, possibly pressured by profit-taking and position adjustments. Nevertheless, XAU/USD remains on track to post gains for December and extend its winning streak into a fifth consecutive month.

Bitcoin, Ethereum and XRP prepare for a potential New Year rebound

Bitcoin, Ethereum, and Ripple are holding steady on Wednesday after recording minor gains on the previous day. Technically, Bitcoin could extend gains within a triangle pattern while Ethereum and Ripple face critical overhead resistance. 

Economic outlook 2026-2027 in advanced countries: Solidity test

After a year marked by global economic resilience and ending on a note of optimism, 2026 looks promising and could be a year of solid economic performance. In our baseline scenario, we expect most of the supportive factors at work in 2025 to continue to play a role in 2026.

Crypto market outlook for 2026

Year 2025 was volatile, as crypto often is.  Among positive catalysts were favourable regulatory changes in the U.S., rise of Digital Asset Treasuries (DAT), adoption of AI and tokenization of Real-World-Assets (RWA).