|

Silver Price Analysis: XAG/USD refreshes daily tops near mid-$25.00s, bearish bias remains

  • Silver once again attracted some dip-buying near the key $25.00 psychological mark.
  • The set-up still favours bearish traders and supports prospects for further weakness.
  • A sustained move beyond the $26.00 mark is needed to negate the bearish outlook.

Silver (XAG/USD) managed to regain some positive traction on Tuesday and stalled the previous day's retracement slide from the $26.00 mark. The intraday positive move pushed the metal to fresh daily tops, around mid-$25.00s during the early European session.

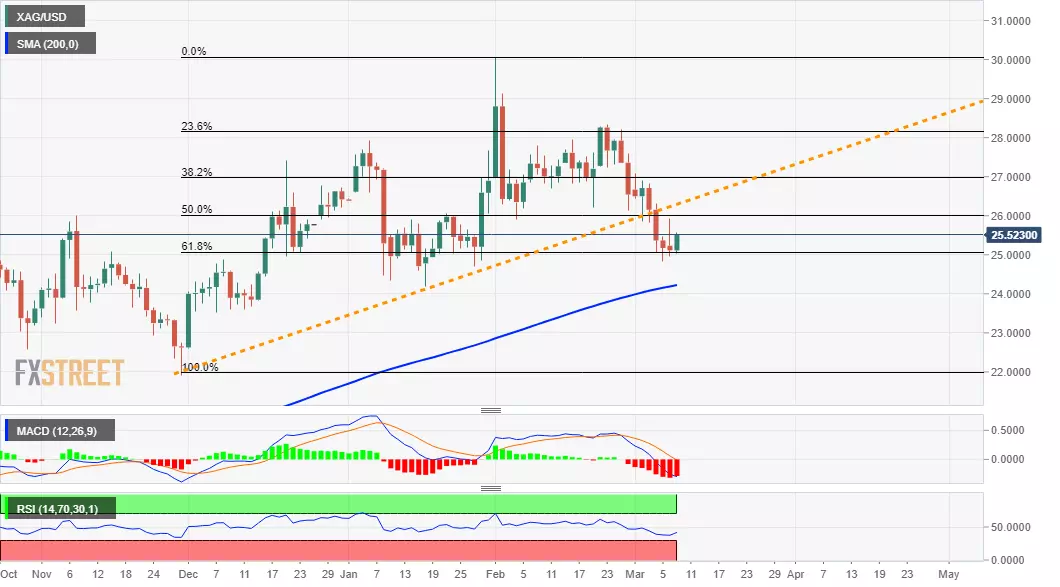
From a technical perspective, the XAG/USD once again managed to find decent support near the key $25.00 psychological mark. The mentioned level marks the 50% Fibonacci level of the $21.90-$30.07 strong move up and should now act as a key pivotal point for short-term traders. Meanwhile, technical indicators on the 1-hourly chart have just started moving back into the positive territory. That said, bearish oscillators on 4-hourly/daily charts warrant caution for bulls, instead supports prospects for the emergence of some fresh selling at higher levels.

Hence, any subsequent positive move might still be seen as an opportunity for bearish traders and runs the risk of fizzling out rather quickly. The XAG/USD still seems vulnerable to prolong its recent sharp retracement slide from the $30.00 level touched on February 1. Sustained weakness below the 61.8% Fibo. level, nearing five-week lows around the $24.85-80 region set on Friday, will reaffirm the bearish bias. The XAG/USD might then accelerate the slide further towards challenging the very important 200-day SMA, currently near the $24.00 mark.

On the flip side, the overnight swing highs, around the $26.00 mark (50% Fibo. level) should continue to act as immediate strong resistance. A convincing breakthrough will negate the near-term bearish outlook and prompt some aggressive short-covering move. The XAG/USD could then climb back towards the $26.75-80 supply zone before eventually darting towards the 38.2% Fibo. level, around the $27.00 round-figure mark.

XAG/USD daily chart

fxsoriginal

Technical levels to watch

XAG/USD

Overview
Today last price25.49
Today Daily Change0.38
Today Daily Change %1.51
Today daily open25.11
 
Trends
Daily SMA2026.88
Daily SMA5026.47
Daily SMA10025.44
Daily SMA20024.19
 
Levels
Previous Daily High25.93
Previous Daily Low24.95
Previous Weekly High27.08
Previous Weekly Low24.83
Previous Monthly High30.07
Previous Monthly Low25.9
Daily Fibonacci 38.2%25.32
Daily Fibonacci 61.8%25.55
Daily Pivot Point S124.73
Daily Pivot Point S224.35
Daily Pivot Point S323.76
Daily Pivot Point R125.71
Daily Pivot Point R226.31
Daily Pivot Point R326.69

Author

Haresh Menghani

Haresh Menghani is a detail-oriented professional with 10+ years of extensive experience in analysing the global financial markets.

More from Haresh Menghani
Share:

Markets move fast. We move first.

Orange Juice Newsletter brings you expert driven insights - not headlines. Every day on your inbox.

By subscribing you agree to our Terms and conditions.

Editor's Picks

EUR/USD trades around 1.1700 after rebounding from 50-day EMA

EUR/USD gains ground after three days of losses, trading around 1.1700 during the Asian hours on Wednesday. On the daily chart, technical analysis indicates a potential for a bearish bias; the 14-day Relative Strength Index at 47 confirms waning momentum.

GBP/USD consolidates around 1.3500; looks to US macro data for fresh impetus

The GBP/USD pair oscillates in a narrow range, around the 1.3500 psychological mark during the Asian session on Wednesday, and for now, seems to have stalled the previous day's retracement slide from its highest level since September 18. Moreover, the fundamental backdrop seems tilted in favor of bullish traders and suggests that the path of least resistance for spot prices is to the upside.

Gold sees profit-taking decline after facing rejection at $4,500

Gold price sees a decline on profit-taking after facing rejection at $4,500 in the Asian trading hours on Wednesday. Despite the pullback, the traditional safe haven remains underpinned by geopolitical tensions and expectations of Fed rate cuts. The US ADP Jobs data, JOLTS Job Openings Survey and ISM Services Purchasing Managers Index report will be published on Wednesday. 

Pump.fun prepares for early-year rally as DEX volume skyrockets

Pump.fun (PUMP) is rising alongside crypto majors such as Bitcoin (BTC) and is trading above $0.002400 at the time of writing on Tuesday. The Decentralized Exchange (DEX) native token outlook builds on a bullish tone developed since December 30.

Implications of US intervention in Venezuela

Events in Venezuela are top of mind for market participants, and while developments are associated with an elevated degree of uncertainty, we are not making any changes to our markets or economic forecasts as a result of the deposition of Nicolás Maduro. 

Cardano holds steady as bulls intensify push for breakout

Cardano rises above the 50-day EMA resistance amid a risk-on mood across the crypto market. The MACD upholds positive divergence, increasing the potential for a 20% breakout to $0.505.