|

Silver Price Analysis: XAG/USD recovers from two-week low, not out of the woods yet

  • Silver regains some positive traction and snaps a three-day losing streak to a two-week low.
  • The technical setup favours support prospects for the emergence of selling at higher levels.
  • Any subsequent move up might still be seen as a selling opportunity and fizzle out quickly.

Silver attracts some buying on Friday and reverses a part of the previous day's losses to the $23.00 neighbourhood, or a two-week low. The white metal sticks to intraday gains, just below mid-$23.00s through the first half of the European session and for now, seems to have stalled this week's pullback from over an eight-month high.

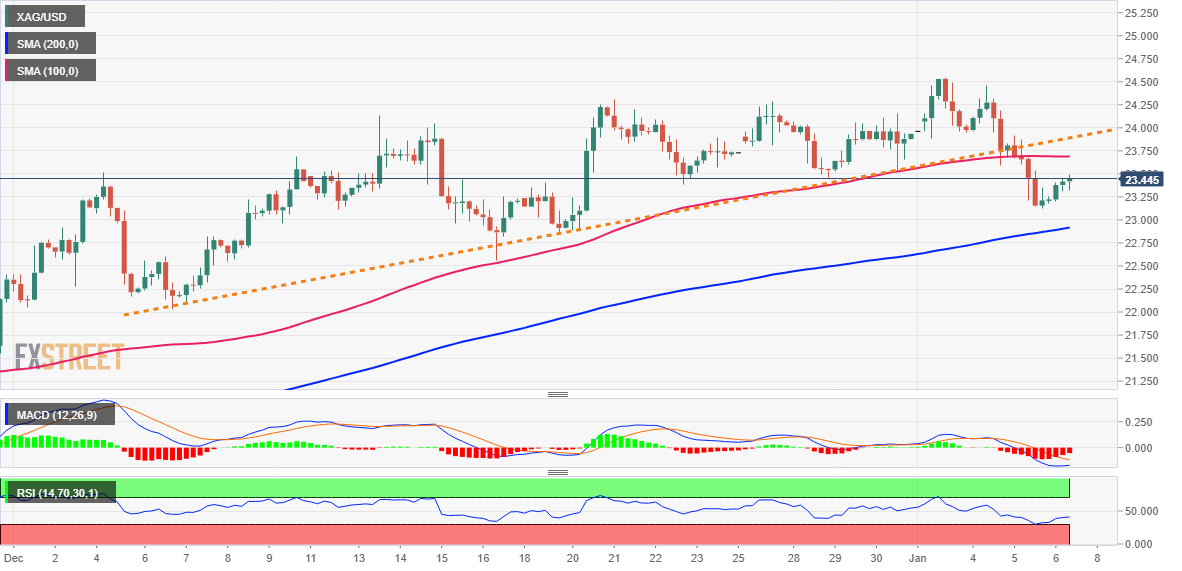
The technical setup, however, still seems tilted in favour of bearish traders, warranting some caution before positioning for any further intraday positive move. This week's break below a two-month-old ascending trend line and a subsequent slide below the 200-period SMA on the 4-hour chart validates the negative outlook. Furthermore, oscillators on the daily chart have been losing momentum and support prospects for the emergence of fresh selling at higher levels.

Hence, any subsequent move up is more likely to meet with a fresh supply near the $23.70 area, or the 200-period SMA on the 4-hour chart. This, in turn, should cap the XAG/USD near the aforementioned ascending trend-line support breakpoint, now turned resistance, around the $23.90-$24.00 zone. The latter coincides with the overnight swing high and should act as a pivotal point, which if cleared decisively might prompt some short-covering around the white metal.

The XAG/USD might then aim to surpass an intermediate resistance near the $24.25 area, which is followed by the multi-month high, around the $24.50-$24.55 region set on Tuesday. A sustained strength beyond the latter will negate any near-term negative outlook and allow bulls to reclaim the $25.00 psychological mark for the first time since April 2022.

On the flip side, the $23.20-$23.10 area now seems to have emerged as immediate support. Some follow-through selling below the $23.00 round figure could drag the XAG/USD towards the $22.60-$22.55 region en route to the next relevant support near the $22.10-$22.00 horizontal zone. Failure to defend the said support levels will be seen as a fresh trigger for bearish traders and set the stage for a further near-term depreciating move.

Silver 4-hour chart

fxsoriginal

Key levels to watch

XAG/USD

Overview
Today last price23.42
Today Daily Change0.18
Today Daily Change %0.77
Today daily open23.24
 
Trends
Daily SMA2023.66
Daily SMA5022.22
Daily SMA10020.66
Daily SMA20021.1
 
Levels
Previous Daily High23.92
Previous Daily Low23.12
Previous Weekly High24.28
Previous Weekly Low23.46
Previous Monthly High24.3
Previous Monthly Low22.03
Daily Fibonacci 38.2%23.42
Daily Fibonacci 61.8%23.61
Daily Pivot Point S122.93
Daily Pivot Point S222.62
Daily Pivot Point S322.13
Daily Pivot Point R123.73
Daily Pivot Point R224.22
Daily Pivot Point R324.53

Author

Haresh Menghani

Haresh Menghani is a detail-oriented professional with 10+ years of extensive experience in analysing the global financial markets.

More from Haresh Menghani
Share:

Editor's Picks

EUR/USD slumps below 1.1750 as USD benefits from risk-aversion

EUR/USD comes under renewed bearish pressure in the European session and trades below 1.1750 following a recovery attempt earlier in the day. The US Dollar gathers strength and weighs on the pair as investors seek refuge in the wake of Israel and the United States' joint attack on Iran.

GBP/USD targets 1.3500 barrier near moving averages

GBP/USD rebounds from the daily losses, trading around 1.3450 during the Asian hours on Monday. The technical analysis of the daily chart indicates an ongoing bearish bias, as the pair trades within a descending channel pattern.

Gold surges on safe-haven demand, rises above $5,400

Gold benefits from intense risk-aversion on Monday and climbs above $5,400, setting a fresh monthly-high in the process. Tensions in the Middle East remain high as Israel and Hezbollah continue to exchange strikes following the US-Israel joint attack on Iran over the weekend.

Bitcoin, Ethereum and Ripple under pressure as key supports face breakdown risk

Bitcoin, Ethereum, and Ripple prices trade on the back foot at the start of this week on Monday, after extending losses in the previous week. BTC is on the brink of a breakdown, ETH is capped below key resistance, and XRP risks a crack of the trendline.

The market is paying for insurance, not apocalypse

As expected, this morning felt less like a Monday market open and more like a fire drill. Futures screens flickered red. S&P contracts down almost 1%. Nasdaq off 1.2%. Brent leaped 13% through $80. Gold rose 1.6% toward $5350 before paring some gains. The dollar is strutting mildly. The Swiss franc is quietly doing what it always does in a storm, catching some safe-haven flows.

Pi Network Price Forecast: Core team offloads supply, weighing on PI recovery

Pi Network  hovers below $0.1700, broadly steady at press time on Monday, attempting a recovery after a 2% loss the previous day. Sunday’s decline aligned with nearly 49 million PI tokens offloaded by the Pi Foundation, implying a spike in supply pressure that capped the prevailing four-day recovery.