Silver Price Analysis: XAG/USD reached a new two-day high but fell short of $24.00


  • XAG/USD stays firm and climbs as the US Dollar remains offered across the board.
  • Silver Price Analysis: Range-bound but could turn bullish above $24.50; otherwise, it could re-test the 50-DMA.

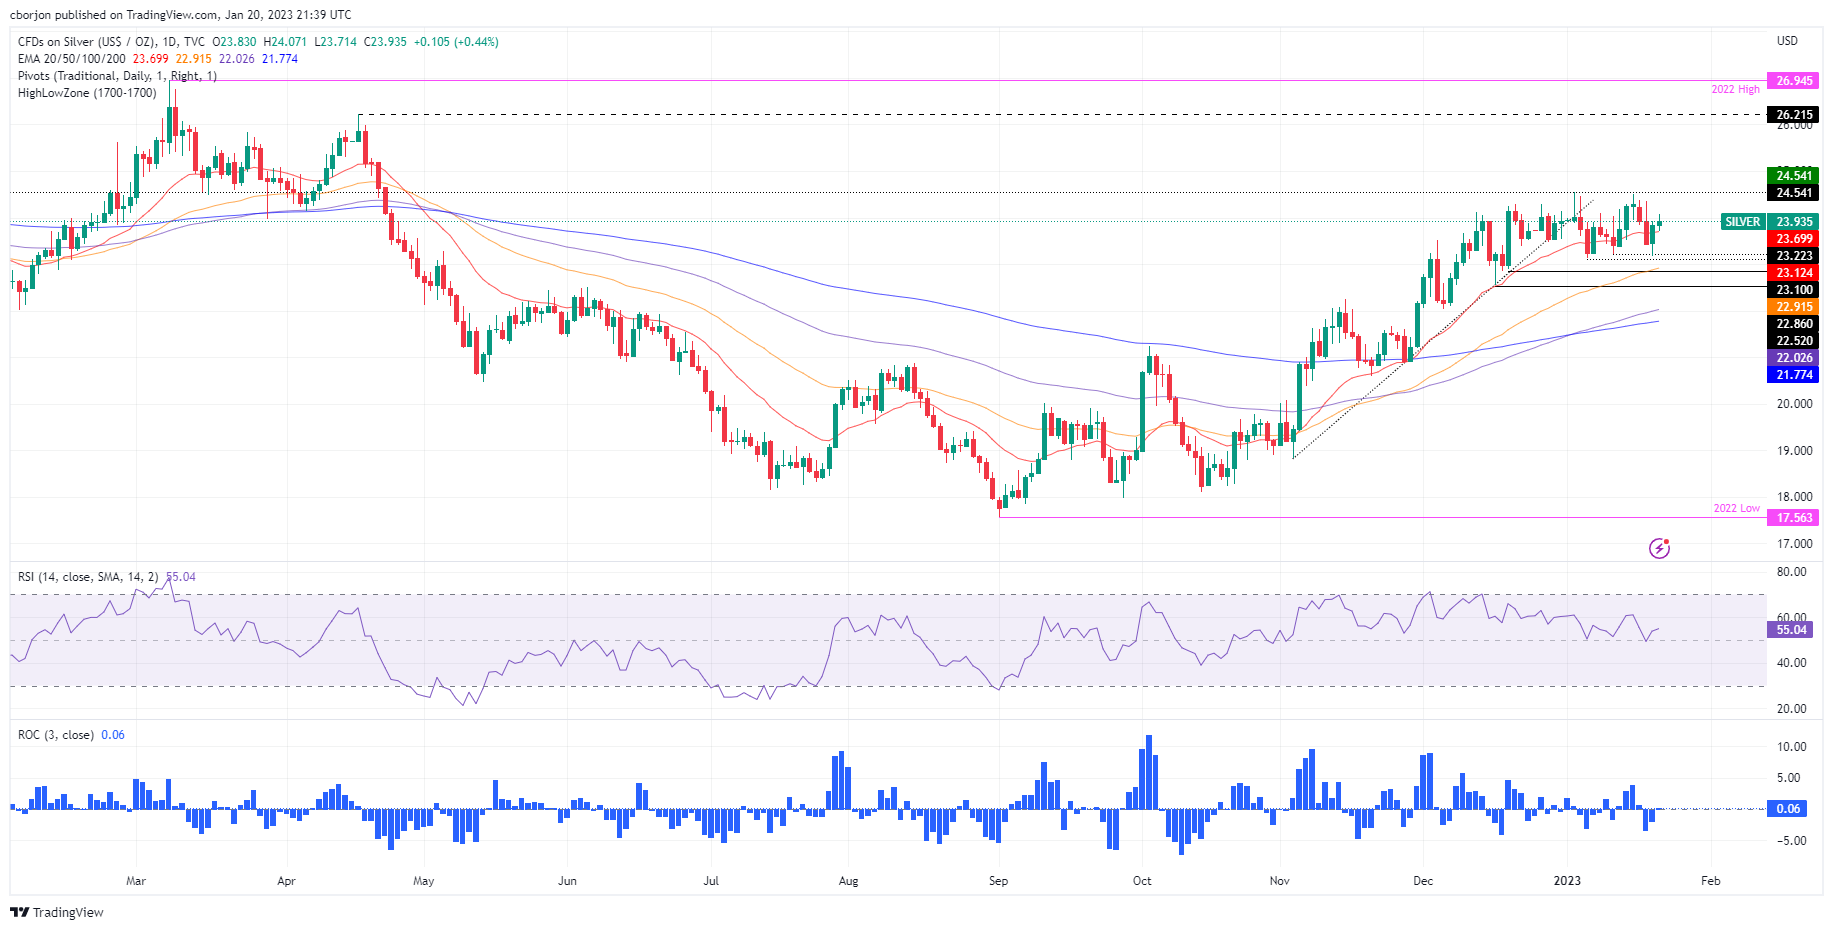
Silver price extended its gains for the second consecutive day, cleared Thursday’s daily high of $23.93, and held its ground above the 20-day Exponential Moving Average (EMA), reaching a new two-day high at $24.07. Nevertheless, as the North American session progressed, the XAG/USD retraced below $24.00 and is trading at $23.93.

Silver Price Analysis: XAG/USD Technical Outlook

XAG/USD daily chart suggests the white metal is peaking at around the $24.50 area, despite breaching the 20-day EMA on Thursday. After testing the YTD high of $24.54 twice during the month, XAG/USD dropped to its 2023 low of $23.12 and, since then, has not been able to crack the $24.00 figure decisively. Further, the Relative Strength Index (RSI) resumed its upward trajectory, but the Rate of Change (RoC) suggests that buyers are gathering some momentum.

Given the above scenario, if XAG/USD clears $24.50, that would keep buyers in charge, and it would open the door to test the $25.00 psychological level. A break above will expose the April 18 daily high at $26.21.

As an alternate scenario, the XAG/USD first support would be the 20-day Exponential Moving Average (EMA) at 23.69. A breach of the latter would send Silver sliding toward the January 19 pivot low of $23.17, ahead of the $23.00 figure, which sits slightly above the 50-day EMA at $22.91.

Silver Key Technical Levels

XAG/USD

Overview
Today last price 23.94
Today Daily Change 0.08
Today Daily Change % 0.34
Today daily open 23.86
 
Trends
Daily SMA20 23.79
Daily SMA50 22.93
Daily SMA100 21.17
Daily SMA200 21.05
 
Levels
Previous Daily High 23.94
Previous Daily Low 23.17
Previous Weekly High 24.3
Previous Weekly Low 23.22
Previous Monthly High 24.3
Previous Monthly Low 22.03
Daily Fibonacci 38.2% 23.65
Daily Fibonacci 61.8% 23.46
Daily Pivot Point S1 23.37
Daily Pivot Point S2 22.89
Daily Pivot Point S3 22.6
Daily Pivot Point R1 24.15
Daily Pivot Point R2 24.43
Daily Pivot Point R3 24.92


Share: Feed news

Information on these pages contains forward-looking statements that involve risks and uncertainties. Markets and instruments profiled on this page are for informational purposes only and should not in any way come across as a recommendation to buy or sell in these assets. You should do your own thorough research before making any investment decisions. FXStreet does not in any way guarantee that this information is free from mistakes, errors, or material misstatements. It also does not guarantee that this information is of a timely nature. Investing in Open Markets involves a great deal of risk, including the loss of all or a portion of your investment, as well as emotional distress. All risks, losses and costs associated with investing, including total loss of principal, are your responsibility. The views and opinions expressed in this article are those of the authors and do not necessarily reflect the official policy or position of FXStreet nor its advertisers. The author will not be held responsible for information that is found at the end of links posted on this page.

If not otherwise explicitly mentioned in the body of the article, at the time of writing, the author has no position in any stock mentioned in this article and no business relationship with any company mentioned. The author has not received compensation for writing this article, other than from FXStreet.

FXStreet and the author do not provide personalized recommendations. The author makes no representations as to the accuracy, completeness, or suitability of this information. FXStreet and the author will not be liable for any errors, omissions or any losses, injuries or damages arising from this information and its display or use. Errors and omissions excepted.

The author and FXStreet are not registered investment advisors and nothing in this article is intended to be investment advice.

Recommended content


Recommended content

Editors’ Picks

EUR/USD retreats to 1.0750, eyes on Fedspeak

EUR/USD retreats to 1.0750, eyes on Fedspeak

EUR/USD stays under modest bearish pressure and trades slightly near 1.0750 on Wednesday. Hawkish comments from Fed officials help the US Dollar stay resilient and don't allow the pair to stage a rebound.

EUR/USD News

GBP/USD struggles to hold above 1.2500 ahead of Thursday's BoE event

GBP/USD struggles to hold above 1.2500 ahead of Thursday's BoE event

GBP/USD stays on the back foot and trades in negative territory below 1.2500 after losing nearly 0.5% on Tuesday. The renewed US Dollar strength on hawkish Fed comments weighs on the pair as market focus shifts to the BoE's policy announcements on Thursday.

GBP/USD News

Gold fluctuates in narrow range below $2,320

Gold fluctuates in narrow range below $2,320

After retreating to the $2,310 area early Wednesday, Gold regained its traction and rose toward $2,320. Hawkish tone of Fed policymakers help the US Treasury bond yields edge higher and make it difficult for XAU/USD to gather bullish momentum.

Gold News

SEC vs. Ripple lawsuit sees redacted filing go public, XRP dips to $0.51

SEC vs. Ripple lawsuit sees redacted filing go public, XRP dips to $0.51

Ripple (XRP) dipped to $0.51 low on Wednesday, erasing its gains from earlier this week. The Securities and Exchange Commission (SEC) filing is now public, in its redacted version. 

Read more

Softer growth, cooler inflation and rate cuts remain on the horizon

Softer growth, cooler inflation and rate cuts remain on the horizon

Economic growth in the US appears to be in solid shape. Although real GDP growth came in well below consensus expectations, the headline miss was mostly the result of larger-than-anticipated drags from trade and inventories.

Read more

Forex MAJORS

Cryptocurrencies

Signatures