|

Silver Price Analysis: XAG/USD rally pauses as ‘doji’ emerges as US yields climb

  • Silver trades at $29.60, posting slight losses of 0.04% amid mixed US economic data.
  • Technical outlook shows a ‘doji’ pattern, signaling indecision among traders.
  • Silver must stay above $29.00 to challenge the YTD high of $29.79 and further resistance levels at $32.15 and $35.40.

Silver’s advancement paused on Thursday, as the grey metal posted minuscule losses of 0.04%, exchanging hands virtually unchanged. Jobs data, along with mixed housing data and the lack of strength in the manufacturing and industrial sectors, boosted US yields and the Greenback. Therefore, the grey metal dropped and traded at $29.60 at the time of writing.

XAG/USD Price Analysis: Technical outlook

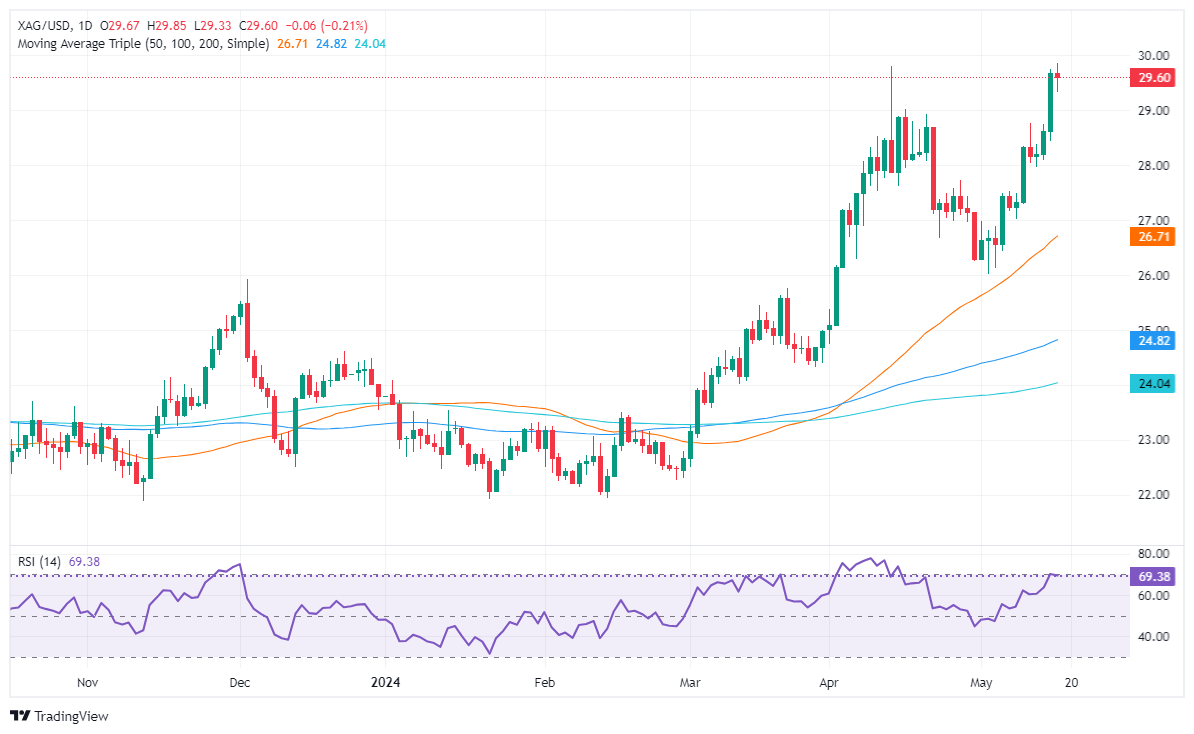
Silver’s uptrend remains in place, but Thursday’s price action forming a ‘doji’ indicates that neither buyers nor sellers are in the domain of price action. It should be said that a ‘double top’ looms. However, momentum favors the former, as the Relative Strength Index (RSI) continues to aim upward despite approaching overbought conditions.

That said, if XAG/USD stays above $29.00, buyers could remain hopeful of testing the year-to-date (YTD) high of $29.79. A breach of the latter will pave the way to challenge the February 2013 high of $32.15, followed by the October 2012 high of $35.40.

Conversely, sellers must drag Silver’s price below the $29.00 figure. In that outcome, the pullback could reach the May 18, 2021, high turned support at $28.75, followed by the $28.00 mark. Further losses lie below the latter, with key support seen at $27.00.

XAG/USD Price Action – Daily Chart

XAG/USD

Overview
Today last price29.63
Today Daily Change-0.04
Today Daily Change %-0.13
Today daily open29.67
 
Trends
Daily SMA2027.58
Daily SMA5026.6
Daily SMA10024.77
Daily SMA20024
 
Levels
Previous Daily High29.74
Previous Daily Low28.44
Previous Weekly High28.77
Previous Weekly Low26.44
Previous Monthly High29.8
Previous Monthly Low24.75
Daily Fibonacci 38.2%29.24
Daily Fibonacci 61.8%28.93
Daily Pivot Point S128.82
Daily Pivot Point S227.98
Daily Pivot Point S327.52
Daily Pivot Point R130.12
Daily Pivot Point R230.58
Daily Pivot Point R331.43

Author

Christian Borjon Valencia

Christian Borjon began his career as a retail trader in 2010, mainly focused on technical analysis and strategies around it. He started as a swing trader, as he used to work in another industry unrelated to the financial markets.

More from Christian Borjon Valencia
Share:

Markets move fast. We move first.

Orange Juice Newsletter brings you expert driven insights - not headlines. Every day on your inbox.

By subscribing you agree to our Terms and conditions.

Editor's Picks

EUR/USD climbs toward 1.1800 on broad USD weakness

EUR/USD gathers bullish momentum and advances toward 1.1800 in the second half of the day on Tuesday. The US Dollar weakens and helps the pair stretch higher after the employment report showed that Nonfarm Payrolls declined by 105,000 in October before rising by 64,000 in November.

GBP/USD climbs to fresh two-month high above 1.3400

GBP/USD gains traction in the American session and trades at its highest level since mid-October above 1.3430. The British Pound benefits from upbeat PMI data, while the US Dollar struggles to find demand following the mixed employment figures and weaker-than-forecast PMI prints, allowing the pair to march north.

Gold extends its consolidative phase around $4,300

Gold trades in positive above $4,300 after spending the first half of the day under bearish pressure. XAU/USD capitalizes on renewed USD weakness after the jobs report showed that the Unemployment Rate climbed to 4.6% in November and the PMI data revealed a loss of growth momentum in the private sector in December. 

US Retail Sales virtually unchanged at $732.6 billion in October

Retail Sales in the United States were virtually unchanged at $732.6 billion in October, the US Census Bureau reported on Tuesday. This print followed the 0.1% increase (revised from 0.3%) recorded in September and came in below the market expectation of +0.1%.

Ukraine-Russia in the spotlight once again

Since the start of the week, gold’s price has moved lower, but has yet to erase the gains made last week. In today’s report we intend to focus on the newest round of peace talks between Russia and Ukraine, whilst noting the release of the US Employment data later on day and end our report with an update in regards to the tensions brewing in Venezuela.

BNB Price Forecast: BNB slips below $855 as bearish on-chain signals and momentum indicators turn negative

BNB, formerly known as Binance Coin, continues to trade down around $855 at the time of writing on Tuesday, after a slight decline the previous day. Bearish sentiment further strengthens as BNB’s on-chain and derivatives data show rising retail activity.