|

Silver Price Analysis: XAG/USD prints bear flag on 4H, $22.50 is the key

  • Silver remains on the back foot inside a bearish chart pattern, snaps three-day uptrend.
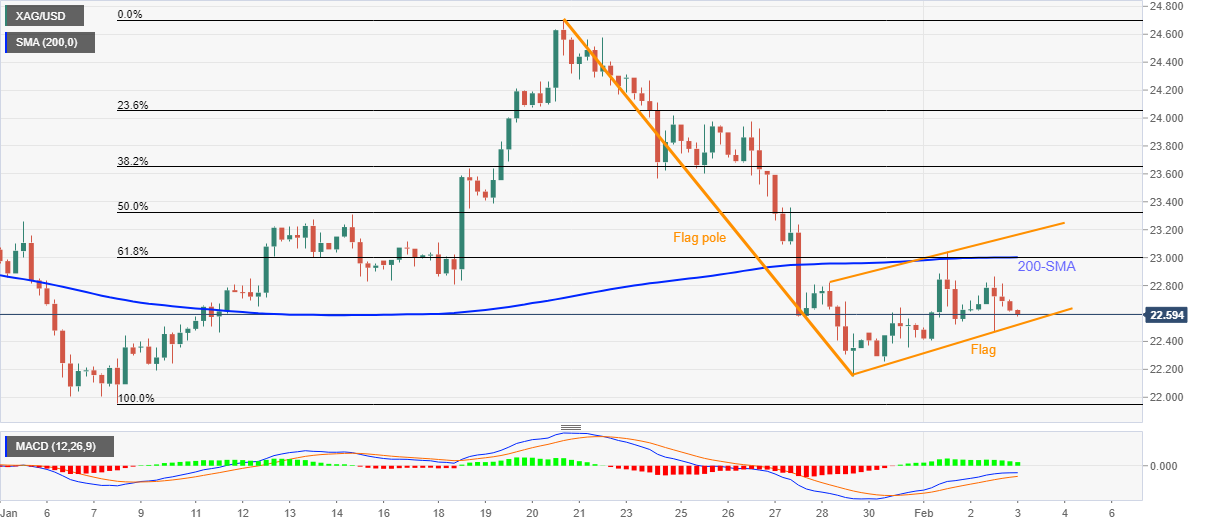
  • Failures to cross 200-SMA, 61.8% Fibonacci retracement keep sellers hopeful.

Silver (XAG/USD) refreshes intraday low around $22.60, 0.31% on a day during early Thursday.

In doing so, the bright metal portrays daily loss for the first time in four while staying inside a bearish flag chart pattern.

That said, the metal’s sustained trading below 200-SMA and 61.8% Fibonacci retracement (Fibo.) of January 07-20 upside, near $23.00, also keep sellers hopeful.

However, a clear downside break of the $22.50 becomes necessary to confirm the theoretical fall targeting the $20.00 threshold. During the fall, the last month’s low near $21.95 and December 2021 bottom surrounding $21.40 may act as intermediate halts.

Alternatively, a daily closing beyond $23.00 isn’t enough to convince silver buyers as the upper line of the stated flag will challenge the run-up near $23.15.

Following that, the 50.0% Fibo. surrounding $23.35 may test XAG/USD bulls before giving them control.

Silver: Four-hour chart

Trend: Further weakness expected

Additional important levels

Overview
Today last price22.61
Today Daily Change-0.05
Today Daily Change %-0.22%
Today daily open22.66
 
Trends
Daily SMA2023.13
Daily SMA5022.84
Daily SMA10023.18
Daily SMA20024.49
 
Levels
Previous Daily High22.87
Previous Daily Low22.47
Previous Weekly High24.31
Previous Weekly Low22.15
Previous Monthly High24.7
Previous Monthly Low21.96
Daily Fibonacci 38.2%22.71
Daily Fibonacci 61.8%22.62
Daily Pivot Point S122.47
Daily Pivot Point S222.27
Daily Pivot Point S322.07
Daily Pivot Point R122.86
Daily Pivot Point R223.06
Daily Pivot Point R323.26

Author

Anil Panchal

Anil Panchal

FXStreet

Anil Panchal has nearly 15 years of experience in tracking financial markets. With a keen interest in macroeconomics, Anil aptly tracks global news/updates and stays well-informed about the global financial moves and their implications.

More from Anil Panchal
Share:

Editor's Picks

AUD/USD eyes 0.7150 barrier nine-day EMA

AUD/USD inches higher after registering modest losses in the previous day, trading around 0.7130 during the Asian hours. The technical analysis of the daily chart indicates that the pair is moving sideways within the rectangle pattern, suggesting a consolidation as neither the bulls nor the bears have enough momentum to take control of the market.

USD/JPY trades below 160.00 intervention threshold; bullish bias intact

The USD/JPY pair attracts some sellers during the Asian session amid fears that authorities will step in again to prop up the Japanese Yen. Furthermore, the Israel-Lebanon truce prompts some profit-taking around the US Dollar and exerts downward pressure on the currency pair.

Gold puts its 200-day SMA to the test near $4,420

Gold keeps the bullish stance in place in the latter part of Thursday’s session, although a convincing break above the key $4,500 mark per troy ounce still remains elusive. The precious metal’s advance comes amid the resurgence of some selling interest around the Greenback, improving risk sentiment, and declining US Treasury yields across the board.

Bitcoin’s massive storm is back: Why the sell-off is far from over

Bitcoin price action over the last few weeks has felt less like a normal, healthy correction and more like a slow grinding crash that continues to wreak havoc on holdings and trading accounts. And everything suggests that the dramatic crash isn’t over.

Nonfarm payrolls: Testing the limits of Fed policy patience

The upcoming nonfarm payrolls report for May will provide the final update on the US labor market before Kevin Warsh attends his first policy meeting as the new Fed Chair later this month.

Recession on paper: What really moves the Canadian Loonie now?

Statistics Canada handed the headline writers a gift and the analysts a headache. Real GDP shrank 0.1% on an annualized basis in the first quarter, and with the fourth quarter of 2025 revised down to a 1.0% contraction, that is two negative quarters in a row, the textbook definition of a technical recession and Canada's first since the pandemic.