Silver Price Analysis: XAG/USD plummets more than 2% and drops below $29.50
- Silver edges down 2.05%, continues three-day decline amid profit-taking.
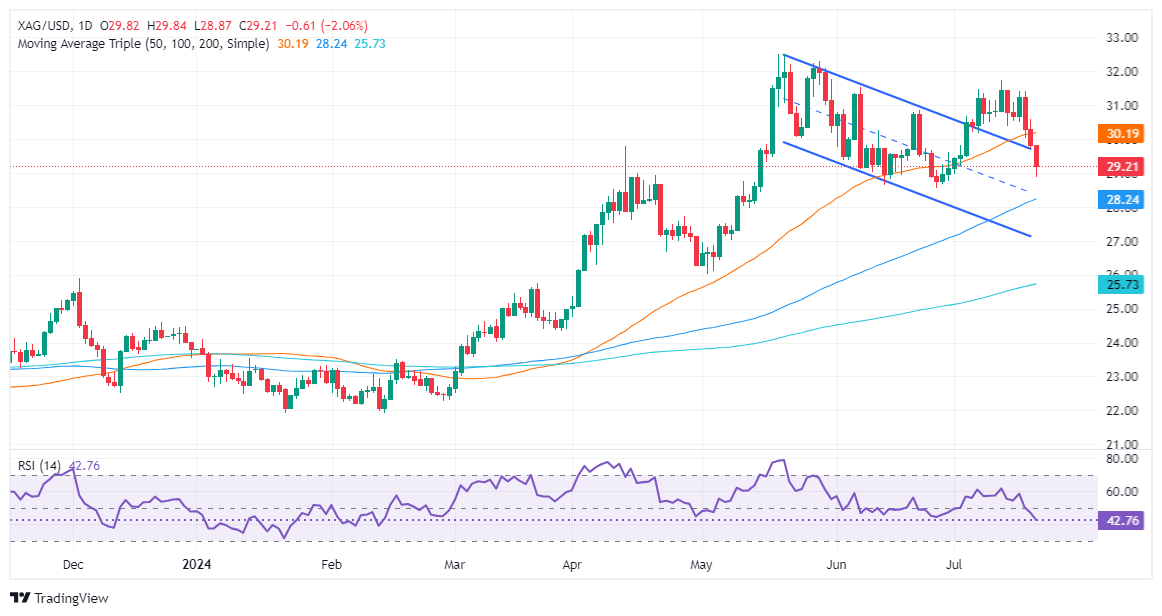
- Technicals suggest more selling as RSI drops below 50.
- Key supports: $29.00, June 26 low of $28.57, 100-DMA at $28.23.
- For bullish turn, XAG/USD must surpass $29.50, with resistance at $30.17 and $31.00.

Silver price extended its losses to three straight days, late in the North American session, plummeting more than 5% weekly due to investors booking profits, according to Jim Wyckoff of Kitco. The grey metal witnessed its meteoric rise of eleven days, ending as the XAG/USD trades beneath the $29.20 mark, losing 2.05%.
XAG/USD Price Analysis: Technical outlook
Although XAG/USD maintains a bullish bias, buyers might find it difficult to gain traction. The Relative Strength Index (RSI) vertical drop that pierced the 50-neutral line depicts that momentum indicates that further selling pressure lies ahead.
On further weakness, the XAG/USD first support would be the $29.00 psychological figure. Once cleared, the next support would be the June 26 low at $28.57, followed by the 100-DMA at $28.23.
For a bullish continuation, the XAG/USD must climb above $29.50 so buyers can test the $30.00 mark. On further strength, Silver’s next resistance would be the 50-DMA at $30.17 before challenging the $31.00 mark.
XAG/USD Price Action – Daily Chart
Silver FAQs
Silver is a precious metal highly traded among investors. It has been historically used as a store of value and a medium of exchange. Although less popular than Gold, traders may turn to Silver to diversify their investment portfolio, for its intrinsic value or as a potential hedge during high-inflation periods. Investors can buy physical Silver, in coins or in bars, or trade it through vehicles such as Exchange Traded Funds, which track its price on international markets.
Silver prices can move due to a wide range of factors. Geopolitical instability or fears of a deep recession can make Silver price escalate due to its safe-haven status, although to a lesser extent than Gold's. As a yieldless asset, Silver tends to rise with lower interest rates. Its moves also depend on how the US Dollar (USD) behaves as the asset is priced in dollars (XAG/USD). A strong Dollar tends to keep the price of Silver at bay, whereas a weaker Dollar is likely to propel prices up. Other factors such as investment demand, mining supply – Silver is much more abundant than Gold – and recycling rates can also affect prices.
Silver is widely used in industry, particularly in sectors such as electronics or solar energy, as it has one of the highest electric conductivity of all metals – more than Copper and Gold. A surge in demand can increase prices, while a decline tends to lower them. Dynamics in the US, Chinese and Indian economies can also contribute to price swings: for the US and particularly China, their big industrial sectors use Silver in various processes; in India, consumers’ demand for the precious metal for jewellery also plays a key role in setting prices.
Silver prices tend to follow Gold's moves. When Gold prices rise, Silver typically follows suit, as their status as safe-haven assets is similar. The Gold/Silver ratio, which shows the number of ounces of Silver needed to equal the value of one ounce of Gold, may help to determine the relative valuation between both metals. Some investors may consider a high ratio as an indicator that Silver is undervalued, or Gold is overvalued. On the contrary, a low ratio might suggest that Gold is undervalued relative to Silver.
Author

Christian Borjon Valencia
FXStreet
Markets analyst, news editor, and trading instructor with over 14 years of experience across FX, commodities, US equity indices, and global macro markets.


