Silver Price Analysis: XAG/USD moves another 2.83% higher and the Gold/Silver ratio breaks an important support


Share:
  • Silver's hot run continues as the precious metal prints above USD 27 per ounce.
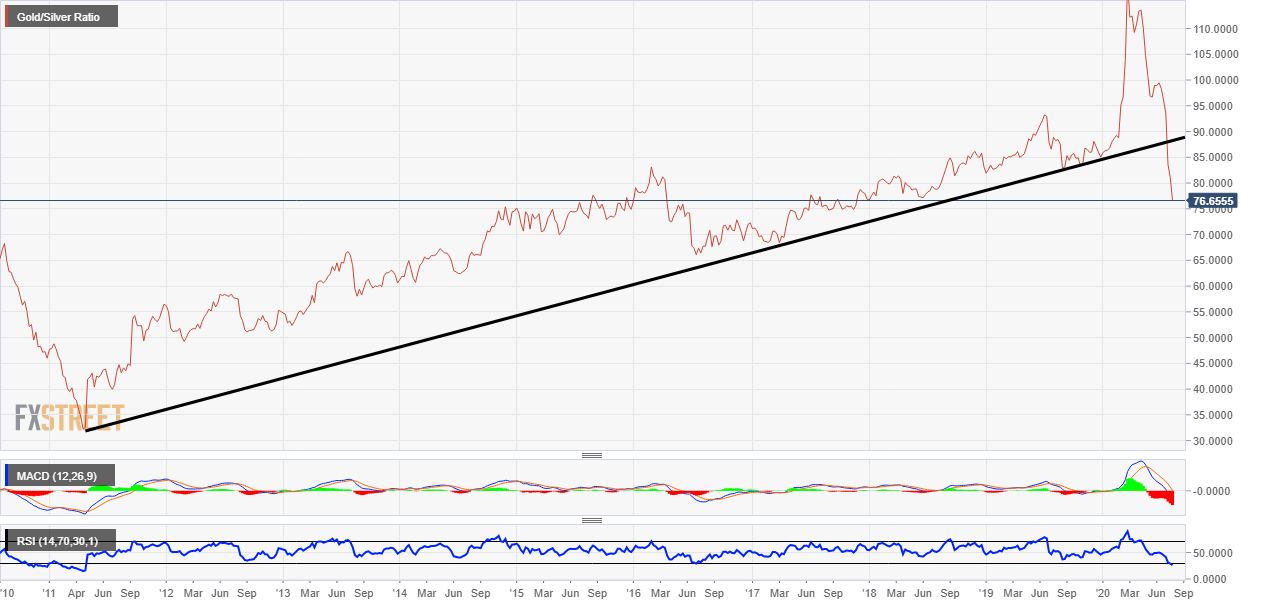
  • The gold/silver ratio is testing a major wave low at 75.44.

Silver 1-hour chart

Silver has had another bullish session on Wednesday, this now takes the year to date performance to a massive 48%. Holdings in silver-backed exchange-traded funds (ETF's) had risen to a record 8,445 tonnes this year. This is almost double the previous record in set 2009. The precious metals complex has been on a great run of late and they normally perform when the market is expecting issue with inflation. This time round some market participants think that the Fed's actions in dealing with the COVID-19 pandemic could increase inflation rates.

Looking at the chart below it seems XAG/USD has hit some resistance at USD 27 per troy ounce. If there is to be a price drop then the previous wave high at the red resistance line could be an area of support. USD 26.20 per ounce was a strong area of resistance in the past and this time round could help stem losses. If the level does break, there is another support zone at the blue level near USD 24.78 per ounce. 

Silver Price Analysis

Gold/Silver ratio weekly chart

The Gold/Silver ratio weekly chart shows a clear trend change. The black trendline has now been taken out and this is significant as it spans nine years. On the lower timeframes, the support level at 75.44 was also broken although the price has moved back above it now. If this trend continues there could be more potential in solver than there is in gold and the ratio is definitely one to keep an eye on.

Gold/Silver Ratio Technical Analysis

Additional levels

XAG/USD

Overview
Today last price 26.74
Today Daily Change 0.74
Today Daily Change % 2.85
Today daily open 26
 
Trends
Daily SMA20 21.67
Daily SMA50 19.32
Daily SMA100 17.21
Daily SMA200 17.32
 
Levels
Previous Daily High 26.04
Previous Daily Low 24.14
Previous Weekly High 26.21
Previous Weekly Low 22.32
Previous Monthly High 26.21
Previous Monthly Low 17.76
Daily Fibonacci 38.2% 25.31
Daily Fibonacci 61.8% 24.86
Daily Pivot Point S1 24.75
Daily Pivot Point S2 23.49
Daily Pivot Point S3 22.85
Daily Pivot Point R1 26.65
Daily Pivot Point R2 27.29
Daily Pivot Point R3 28.55


Share: Feed news

All information and content on this website, from this website or from FX daily ltd. should be viewed as educational only. Although the author, FX daily ltd. and its contributors believe the information and contents to be accurate, we neither guarantee their accuracy nor assume any liability for errors. The concepts and methods introduced should be used to stimulate intelligent trading decisions. Any mention of profits should be considered hypothetical and may not reflect slippage, liquidity and fees in live trading. Unless otherwise stated, all illustrations are made with the benefit of hindsight. There is risk of loss as well as profit in trading. It should not be presumed that the methods presented on this website or from material obtained from this website in any manner will be profitable or that they will not result in losses. Past performance is not a guarantee of future results. It is the responsibility of each trader to determine their own financial suitability. FX daily ltd. cannot be held responsible for any direct or indirect loss incurred by applying any of the information obtained here. Futures, forex, equities and options trading contains substantial risk, is not for every trader, and only risk capital should be used. Any form of trading, including forex, options, hedging and spreads, contains risk. Past performance is not indicative of future FX daily ltd. are not Registered Financial Investment Advisors, securities brokers-dealers or brokers of the U.S. Securities and Exchange Commission or with any state securities regulatory authority OR UK FCA. We recommend consulting with a registered investment advisor, broker-dealer, and/or financial advisor. If you choose to invest, with or without seeking advice, then any consequences resulting from your investments are your sole responsibility FX daily ltd. does not assume responsibility for any profits or losses in any stocks, options, futures or trading strategy mentioned on the website, newsletter, online trading room or trading classes. All information should be taken as educational purposes only.

Follow us on Telegram

Stay updated of all the news

Join Telegram

Recommended content


Follow us on Telegram

Stay updated of all the news

Join Telegram

Recommended content

Editors’ Picks

AUD/USD consolidates its losses around 0.6360 ahead of RBA rate decision

AUD/USD consolidates its losses around 0.6360 ahead of RBA rate decision

The AUD/USD pair consolidates its recent losses above the mid-0.6300s during the early Asian session on Tuesday. Traders prefer to wait on the sidelines ahead of the Reserve Bank of Australia (RBA) monetary policy meeting on Tuesday.

AUD/USD News

EUR/USD slides further under 1.0500 as DXY rises above 107.00

EUR/USD slides further under 1.0500 as DXY rises above 107.00

EUR/USD continued to face downward pressure and dropped below 1.0780, reaching the lowest intraday level since December of last year. The pair remains under pressure as the US Dollar maintains firm support due to higher US yields and cautious market sentiment. The DXY rose above 107.00 for the first time since November.

EUR/USD News

Gold approaches $1,800 as demand for the USD prevails

Gold approaches $1,800 as demand for the USD prevails

Spot Gold fell to a fresh multi-month low of $1,827.11 a troy ounce on Monday amid resurgent  US Dollar demand. The Greenback suffered a minor setback at the beginning of the week, as generally encouraging Chinese data and upbeat United States (US) news underpinned the mood.

Gold News

Bitcoin price macro outlook remains uncertain, analyst says

Bitcoin price macro outlook remains uncertain, analyst says

Bitcoin price is still not in the clear, according to analyst and trader Rekt Capital, who explores the price action on a macro perspective. It comes after the big crypto leaped almost 5%, testing the $28,600 levels before a retraction.

Read more

PMIs paint a bleak picture for manufacturing but China offers hope

PMIs paint a bleak picture for manufacturing but China offers hope

Manufacturing PMIs released throughout the day have made for pretty miserable reading and even those in China barely registered any growth after a lengthy period of contraction. The Chinese data did offer some cause for hope at least, despite ultimately barely sitting in growth territory. 

Read more

Forex MAJORS

Cryptocurrencies

Signatures