|

Silver Price Analysis: XAG/USD looks to build on intraday positive move beyond $24.00 mark

  • Silver regains positive traction and reverses a part of Friday’s pullback from over a one-week top.
  • The technical setup remains tilted in favour of bulls and supports prospects for additional gains.
  • A convincing break below a multi-month-old ascending trend-line will negate the positive outlook.

Silver (XAG/USD) attracts some dip-buying near the $23.70 area on the first day of a new week and builds on its steady intraday ascent heading into the European session. The white metal climbs to the $24.00 mark in the last hour and seems poised to build on its recent solid bounce from the mid-$22.00s, or a near one-month low touched last week.

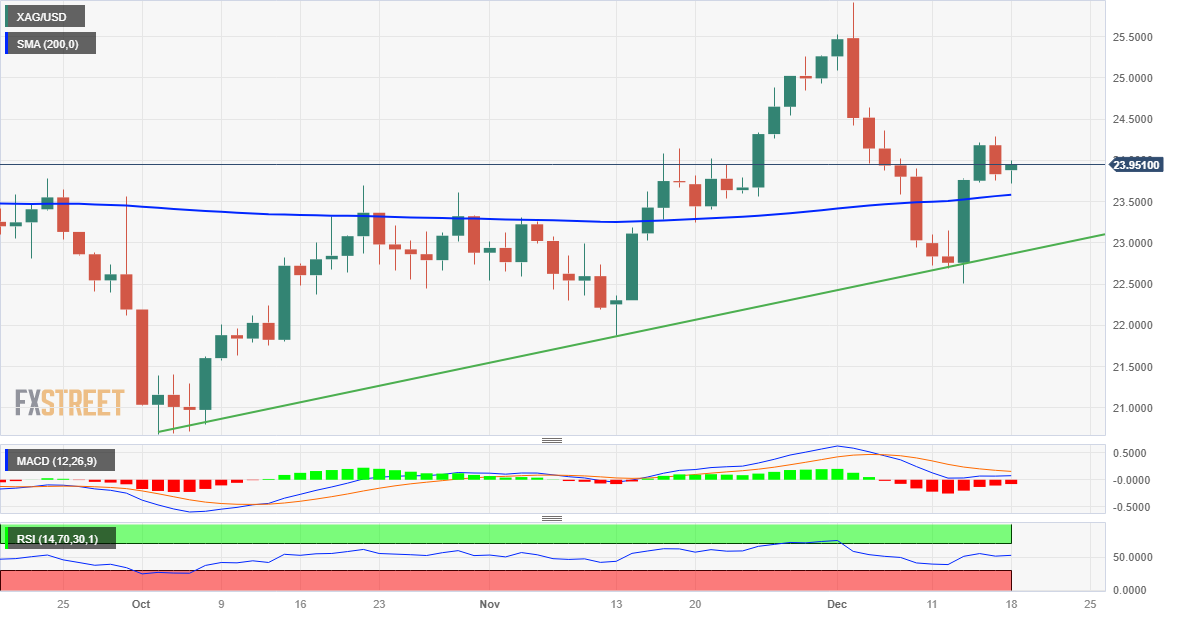
From a technical perspective, the XAG/USD last week showed some resilience below and defended an upward-sloping trend line extending from the October swing low. The subsequent strength and acceptance above the very important 200-day Simple Moving Average (SMA) favours bullish traders. Moreover, oscillators on the daily chart have again started gaining positive traction and support prospects for a further appreciating move.

That said, bulls might wait for some follow-through buying beyond the $24.25-$24.30 area, over a one-week high set on Friday, before placing fresh bets. The XAG/USD might then aim to reclaim the $25.00 psychological mark. The upward trajectory could get extended beyond the $25.25 intermediate hurdle, towards the $25.45-$25.50 region en route to the $26.00 neighbourhood, or the highest level since May 5 touched earlier this month.

On the flip side, any meaningful slide might continue to attract some buyers near the 200-day SMA, currently pegged near the $23.55 region. Some follow-through selling, however, might turn the XAG/USD vulnerable to accelerate the slide back towards the $23.00 mark. The latter nears the aforementioned ascending trend-line support, which if broken decisively will negate the positive outlook and shift the bias in favour of bearish traders.

Silver daily chart

fxsoriginal

Technical levels to watch

XAG/USD

Overview
Today last price23.98
Today Daily Change0.15
Today Daily Change %0.63
Today daily open23.83
 
Trends
Daily SMA2024.05
Daily SMA5023.3
Daily SMA10023.21
Daily SMA20023.57
 
Levels
Previous Daily High24.29
Previous Daily Low23.76
Previous Weekly High24.29
Previous Weekly Low22.51
Previous Monthly High25.27
Previous Monthly Low21.88
Daily Fibonacci 38.2%23.96
Daily Fibonacci 61.8%24.09
Daily Pivot Point S123.63
Daily Pivot Point S223.42
Daily Pivot Point S323.09
Daily Pivot Point R124.17
Daily Pivot Point R224.5
Daily Pivot Point R324.7

Author

Haresh Menghani

Haresh Menghani is a detail-oriented professional with 10+ years of extensive experience in analysing the global financial markets.

More from Haresh Menghani
Share:

Editor's Picks

EUR/USD keeps the offered stance just above 1.1700

EUR/USD is coming under heavy selling pressure in what has been a rather grim start to the new trading week, with the pair now trading close to the 1.1700 support area as the US Dollar stages a solid rebound. The prevailing flight to safety mood continues to favour the Greenback, as investors react to the escalating conflict in the Middle East and trim risk exposure across the board.

GBP/USD hits new yearly lows near 1.3300

GBP/USD adds to the recent bearish tone, approaching to the key 1.3300 support to reach fresh YTD troughs against the backdrop of the robust performance of the US Dollar. Indeed, Cable’s decline comes amid the firm demand for the safe-haven space in the wake of the US and Israel attacks to Iran.

Gold trims losses, back below $5,400

Gold now surrenders part of the earlier advance past the $5,400 mark per troy ounce at the beginning of the week. Indeed, the precious metal’s strong uptick remains fuelled by increasing geopolitical tensions in the Middle East amid the intense demand for safer assets.

Bitcoin on brink of breakdown amid US-Iran war

Bitcoin (BTC) remains under pressure near the key support level of $65,700. Trading at $66,400 at the time of writing on Monday, a breakdown below this critical level would suggest a deeper correction ahead.

The Fed is finally talking about AI – Here's why it matters for the US Dollar

AI is moving from earnings calls into the heart of monetary policy discussions, forcing Federal Reserve officials to confront a new question: How to act if AI reshapes inflation, employment and interest rates at the same time?

Grass 20% bullish breakout defies broader market weakness

Grass (GRASS) is edging up above $0.30 at the time of writing on Monday. The token’s notable 20% intraday surge stands out amid heightened volatility in the broader crypto market.