|

Silver Price Analysis: XAG/USD jumps to multi-day tops, challenges $27.50-60 hurdle

  • Silver edged higher on Monday and built on last week’s bounce from the $25.90 support zone.
  • The set-up seems tilted in favour of bullish traders and supports prospects for additional gains.
  • A sustained break below 100-period SMA on the 4-hourly chart will negate the positive outlook.

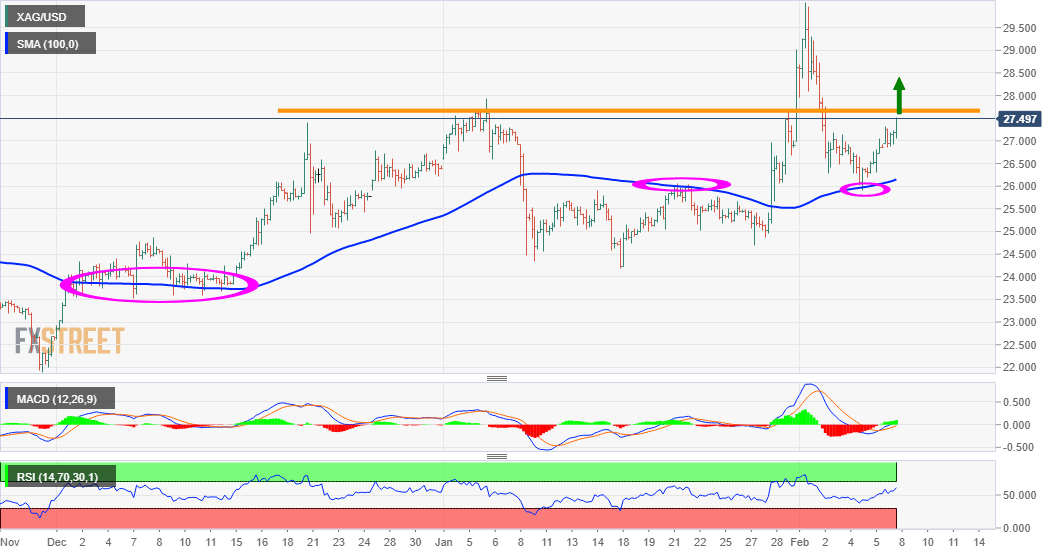
Silver gained positive traction for the second consecutive session on Monday and built on the last week's rebound from sub-$26.00 levels, or support marked by 100-period SMA on the 4-hourly chart. The commodity climbed back above the $27.00 mark and was last seen trading just below the $27.50-60 supply zone.

Meanwhile, technical indicators on the daily chart maintained their bullish bias and have again started moving into the positive territory on the 4-hourly chart. The set-up favours bullish traders and supports prospects for an eventual breakthrough the mentioned barrier, though stronger USD might cap gains.

That said, a sustained move beyond will set the stage for additional gains and lift the XAG/USD back towards the $28.00 mark. Some follow-through buying should pave the way for an extension of the momentum. The commodity might then aim to surpass the $28.20-30 intermediate resistance and reclaim the $29.00 mark.

On the flip side, the daily swing lows, around the $26.85 region, now seems to protect the immediate downside. This is followed by support near the $26.35 level ahead of the 100-period SMA on the 4-hourly chart, currently around the $26.10 zone. Failure to defend the mentioned support levels might turn the XAG/USD vulnerable.

The commodity might then accelerate the fall further below last week's swing lows, around the $25.90 region, towards testing the next relevant support near the key $25.00 psychological mark.

XAG/USD 4-hourly chart

fxsoriginal

Technical levels to watch

XAG/USD

Overview
Today last price27.37
Today Daily Change0.52
Today Daily Change %1.94
Today daily open26.85
 
Trends
Daily SMA2025.91
Daily SMA5025.57
Daily SMA10024.82
Daily SMA20023.09
 
Levels
Previous Daily High27.05
Previous Daily Low26.2
Previous Weekly High30.07
Previous Weekly Low25.9
Previous Monthly High27.92
Previous Monthly Low24.19
Daily Fibonacci 38.2%26.72
Daily Fibonacci 61.8%26.52
Daily Pivot Point S126.35
Daily Pivot Point S225.85
Daily Pivot Point S325.5
Daily Pivot Point R127.2
Daily Pivot Point R227.55
Daily Pivot Point R328.05

Author

Haresh Menghani

Haresh Menghani is a detail-oriented professional with 10+ years of extensive experience in analysing the global financial markets.

More from Haresh Menghani
Share:

Editor's Picks

EUR/USD struggles aroound 1.1800 as USD stabilizes

EUR/USD stays defensive around 1.1800 in the European session on Thursday. The US Dollar stabilizes, following the recent decline led by tariff uncertainty, capping the pair's upside. All eyes now remain on the US-Iran nuclear talks after ECB President Lagarde's testimony fails to impress Euro bulls. 

GBP/USD drops toward 1.3500 as USD finds fresh demand

GBP/USD falls back toward 1.3500 in the European session on Thursday, snapping its recovery momentum. The pair loses traction as the US Dollar finds fresh demand, as markets turn cautious ahead of the US-Iran nuclear talks. The US trade policy uncertainty also remains a drag on risk sentiment. 

Gold clings to gains amid sustained safe-haven flows ahead of US-Iran talks

Gold sticks to its modest intraday gains through the first half of the European session on Thursday, with bulls still awaiting a sustained move and acceptance above the $5,200 mark before placing fresh bets. 

Stellar: Relief bounce fades as bearish undertone persists

Stellar is trading around $0.16 at the time of writing on Thursday after rebounding more than 8% in the previous day. Derivatives data paints a negative picture as XLM’s short bets hit a monthly high while Open Interest continues to decline.

Nvidia delivers another monster earnings report, and forecasts big things to come

It was another monster earnings report from Nvidia for fiscal Q4. Revenues were $68.1bn, smashing estimates of $65bn. Gross profit margin was a healthy 75%, up from 73.5% in the prior quarter, and the outlook for this quarter was monstrous.

Solana strikes key resistance with double-digit gains

Solana trades at $88 at press time on Thursday, after an 11% upswing the previous day within a broader consolidation range of roughly three weeks. Institutional demand for Solana heightens as US spot SOL Exchange Traded Funds record $30 million of inflow on Wednesday.