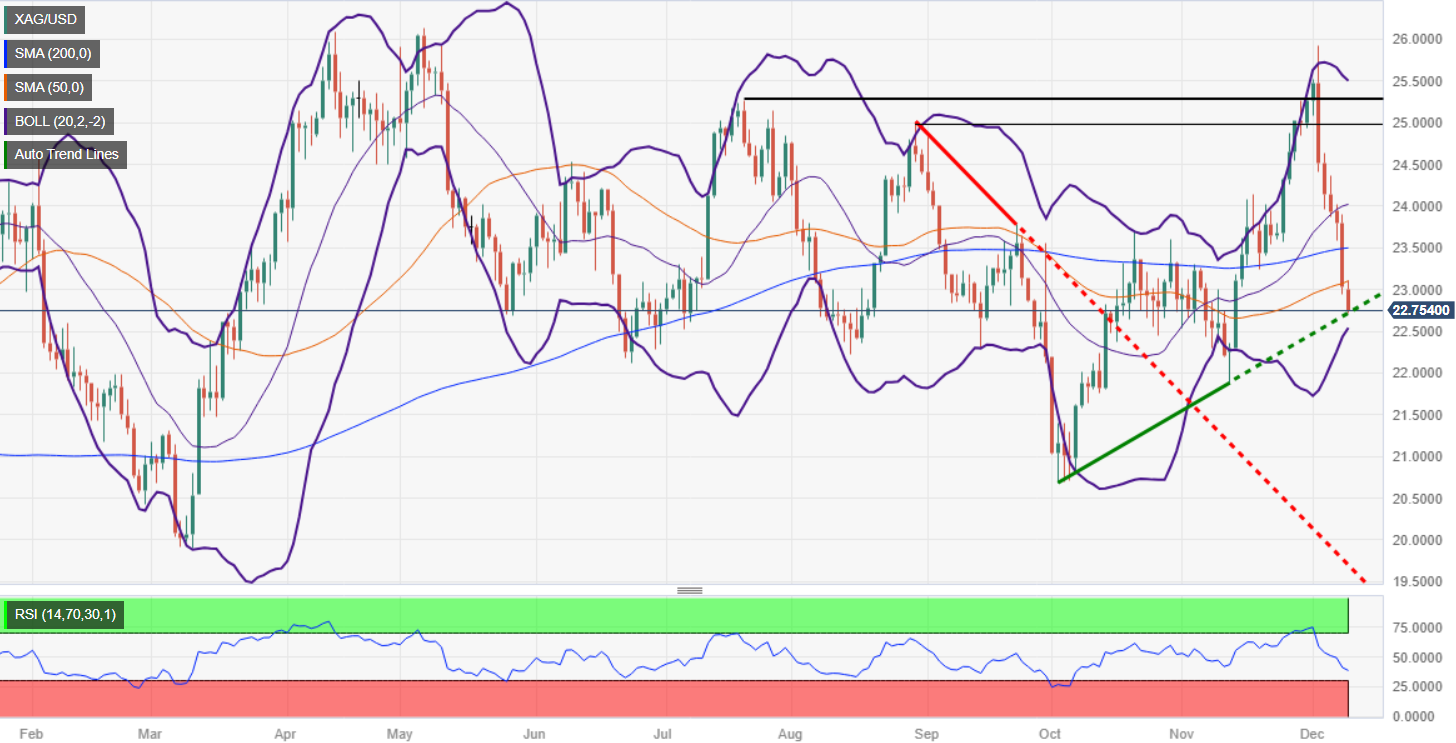
Silver Price Analysis: XAG/USD hurdles key supports, challenges trendline around $22.70
- Silver continues to sink, after hitting $24.63, so far down 10.41% since last week.
- The XAG/USD is bearishly biased, with sellers eyeing $21.88.
- If Silver buyers reclaim $23.00, upside risks emerge with key resistance levels at the 100 and 200 DMAs.

Silver price (XAG/USD) dives during the North American session, though it remains above a two-month-old support trendline that passes at around the $22.70 area. At the time of writing, the XAG/USD is trading at around $22.74, down by 1.02%.
XAG/USD’s daily chart portrays the grey metal as downward biased but its downtrend stalled at a support level. If sellers would like to challenge the November 13 swing low, they must regain the $22.50 area, followed by the $22.00 per troy ounce figure. That would keep the bears in charge and could open the door to test October’s low of $20.69.
For a bullish resumption, XAG/USD buyers need to reclaim the $23.00 mark and the 50-day moving average (DMA) at $23.09. If those two levels are surpassed, bulls could target the 100 and 200-DMAs, each at $23.22 and $23.50, respectively. Once cleared the $24.00 figure would emerge as the next stop.
XAG/USD Price Analysis – Daily Chart
XAG/USD Technical Levels
Author

Christian Borjon Valencia
FXStreet
Markets analyst, news editor, and trading instructor with over 14 years of experience across FX, commodities, US equity indices, and global macro markets.


