|

Silver Price Analysis: XAG/USD gains marginally, hovers around $23.00 on weak USD, falling US bond yields

  • Silver (XAG) trades slightly higher amid declining US Treasury bond yields and broad US Dollar (USD) weakness.
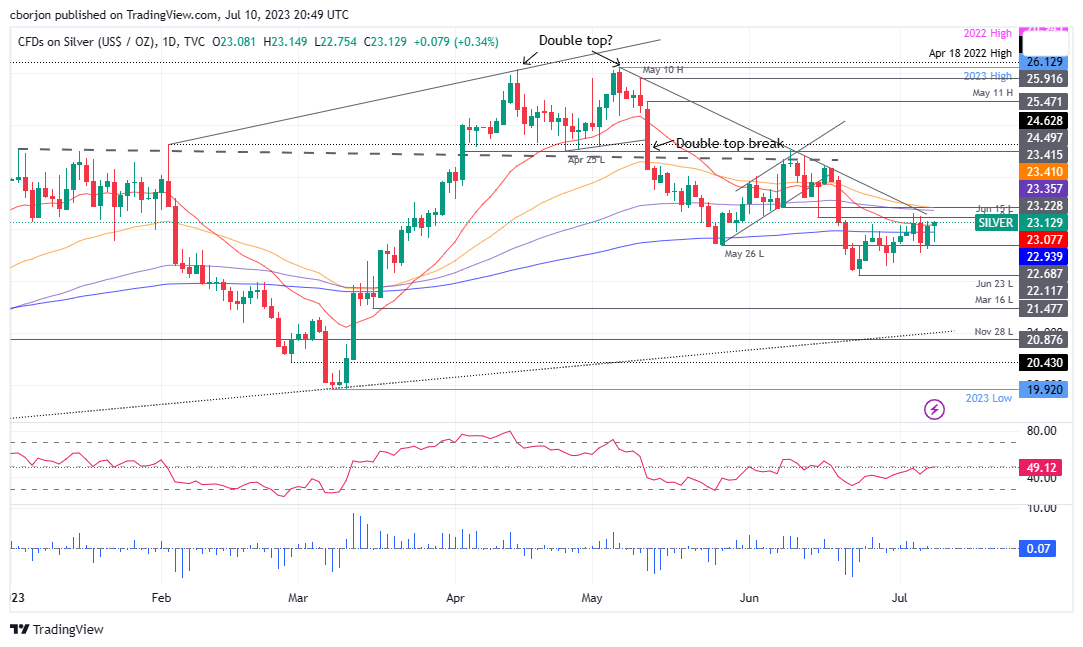
  • For a bearish continuation, a break below the 200-day EMA at $22.93 is needed, with a potential downside to the June 25 daily low of $22.68 and further to $22.11.
  • Conversely, staying above $23.00 may challenge resistances at $23.35/41 (50/100-day EMAs confluence) and then $24.00. A decisive break of these resistances may lead the prices toward $24.20.

Silver price climbs below the $23.00 figure, surpassing the 20-day Exponential Moving Average (EMA) at $23.07 on Monday, courtesy of US Bond yields falling and broad US Dollar (USD) weakness. The XAG/USD is exchanging hands at $23.12, gaining 0.32% as Wall Street’s session ends.

XAG/USD Price Analysis: Technical outlook

After sliding below the 50 and 100-day EMAs, the XAG/USD remains neutral to downward-biased, with price action hoovering around each side of the 20-day EMA and the $23.00 figure. For a bearish continuation, the XAG/USD must drop below the 200-day EMA at $22.93, opening the door for further downside, exposing as next support the June 25 daily low of $22.68.

In a decisive break, XAG/USD would slump and challenge the March 16 daily low of $22.11 before surpassing the $22.00 figure. Once cleared, the next support would be last year’s November 28 daily low of $20.87 before reaching YTD lows of $19.92.

Conversely, if XAG/USD stays afloat above $23.00, resistance levels emerge at the confluence of the 50/100-day EMAs at around $23.35/41. Once broken, the following supply area would be the $24.00 figure, followed by a June 16 daily high of $24.20.

XAG/USD Price Action – Daily chart

XAG/USD Daily chart

XAG/USD

Overview
Today last price23.14
Today Daily Change0.06
Today Daily Change %0.26
Today daily open23.08
 
Trends
Daily SMA2023.14
Daily SMA5023.74
Daily SMA10023.4
Daily SMA20022.68
 
Levels
Previous Daily High23.15
Previous Daily Low22.62
Previous Weekly High23.31
Previous Weekly Low22.52
Previous Monthly High24.53
Previous Monthly Low22.11
Daily Fibonacci 38.2%22.95
Daily Fibonacci 61.8%22.82
Daily Pivot Point S122.74
Daily Pivot Point S222.41
Daily Pivot Point S322.21
Daily Pivot Point R123.28
Daily Pivot Point R223.49
Daily Pivot Point R323.82

Author

Christian Borjon Valencia

Christian Borjon began his career as a retail trader in 2010, mainly focused on technical analysis and strategies around it. He started as a swing trader, as he used to work in another industry unrelated to the financial markets.

More from Christian Borjon Valencia
Share:

Markets move fast. We move first.

Orange Juice Newsletter brings you expert driven insights - not headlines. Every day on your inbox.

By subscribing you agree to our Terms and conditions.

Editor's Picks

EUR/USD climbs toward 1.1800 as US employment data weigh on USD

EUR/USD gains traction and rises toward 1.1800 in the second half of the day on Tuesday. The US Dollar weakens and helps the pair stretch higher after the employment report showed that Nonfarm Payrolls declined by 105,000 in October before rising by 64,000 in November.

GBP/USD clings to gains above 1.3400

GBP/USD stays in positive territory above 1.3400 on Tuesday. The British Pound benefits from upbeat PMI data, while the US Dollar struggles to find demand following the mixed employment figures, allowing the pair to hold its ground.

Gold recovers above $4,300 as markets assess US jobs data

Gold reverses its direction and recovers above $4,300 after spending the first half of the day under bearish pressure. The renewed US Dollar weakness after the jobs report showed that the Unemployment Rate climbed to 4.6% in November helps XAU/USD push higher in the American session.

US Retail Sales virtually unchanged at $732.6 billion in October

Retail Sales in the United States were virtually unchanged at $732.6 billion in October, the US Census Bureau reported on Tuesday. This print followed the 0.1% increase (revised from 0.3%) recorded in September and came in below the market expectation of +0.1%.

Ukraine-Russia in the spotlight once again

Since the start of the week, gold’s price has moved lower, but has yet to erase the gains made last week. In today’s report we intend to focus on the newest round of peace talks between Russia and Ukraine, whilst noting the release of the US Employment data later on day and end our report with an update in regards to the tensions brewing in Venezuela.

BNB Price Forecast: BNB slips below $855 as bearish on-chain signals and momentum indicators turn negative

BNB, formerly known as Binance Coin, continues to trade down around $855 at the time of writing on Tuesday, after a slight decline the previous day. Bearish sentiment further strengthens as BNB’s on-chain and derivatives data show rising retail activity.