|

Silver Price Analysis: XAG/USD flirts with 200-day SMA hurdle near $23.20-25 region

  • Silver attracts some dip-buying ahead of the $23.00 round figure, albeit lacks follow-through.
  • The technical setup favours bullish traders and supports prospects for a further positive move.
  • A sustained strength beyond the $23.60-70 supply zone is needed to reaffirm the bullish bias.

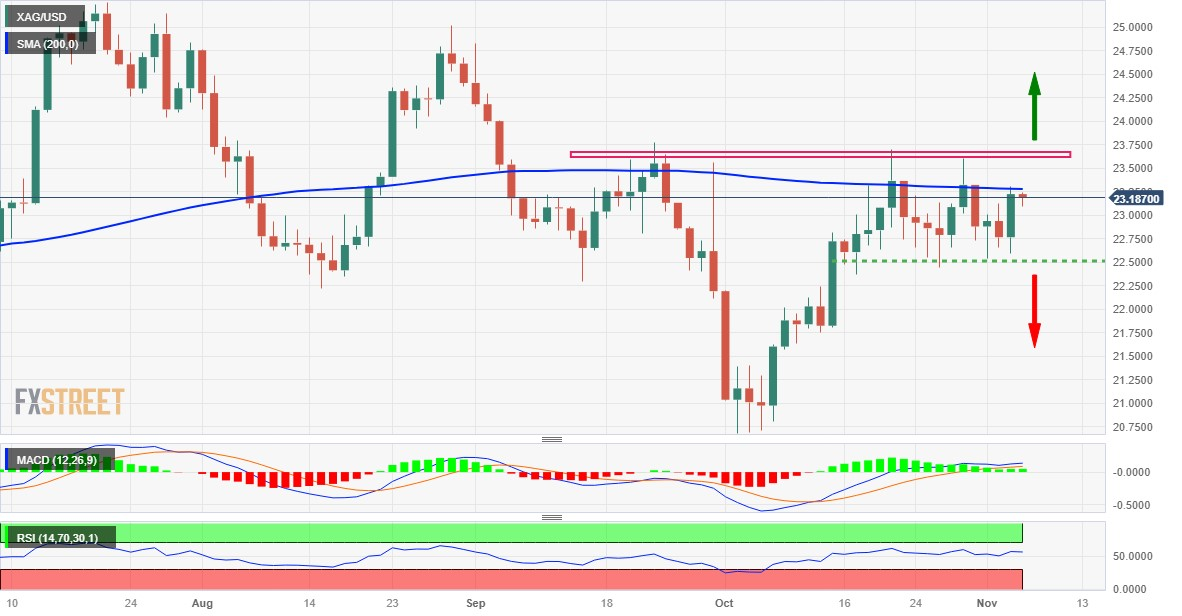
Silver (XAG/USD) reverses an intraday dip to the $23.10 area and climbs to the top end of its daily trading range during the first half of the European session on Monday. Bulls still await a sustained strength beyond the very important 200-day Simple Moving Average (SMA) before placing fresh bets.

Any subsequent move up, however, is more likely to confront stiff resistance near the $23.60-$23.70 supply zone, which should act as a key pivotal point. With oscillators on the daily chart holding in the positive territory, a sustained strength beyond will be seen as a fresh trigger for bullish traders and pave the way for some meaningful upside.

The XAG/USD might then aim to surpass the $24.00 mark and test the next relevant hurdle near the $24.20-$24.25 zone. The momentum could get extended further and allow bulls to make a fresh attempt to conquer the $25.00 psychological mark before the white metal eventually climbs to the July swing high, around the $25.20-$25.25 zone.

On the flip side, any meaningful slide below the $23.00 mark is more likely to find decent support and remain limited near the $22.60-$22.50 horizontal support. A convincing break below the latter will shift the bias back in favour of bearish traders and drag the XAG/USD to the $22.00 mark en route to the $21.70 horizontal support zone.

Some follow-through selling will expose the $21.35-$21.30 support, below which the XAG/USD seems all set to accelerate the fall further below the $21.00 mark, towards the $20.70-$20.65 area, or a seven-month low touched in October.

Silver daily chart

fxsoriginal

Technical levels to watch

XAG/USD

Overview
Today last price23.18
Today Daily Change-0.04
Today Daily Change %-0.17
Today daily open23.22
 
Trends
Daily SMA2022.74
Daily SMA5022.88
Daily SMA10023.2
Daily SMA20023.28
 
Levels
Previous Daily High23.3
Previous Daily Low22.59
Previous Weekly High23.61
Previous Weekly Low22.54
Previous Monthly High23.7
Previous Monthly Low20.68
Daily Fibonacci 38.2%23.03
Daily Fibonacci 61.8%22.86
Daily Pivot Point S122.78
Daily Pivot Point S222.33
Daily Pivot Point S322.06
Daily Pivot Point R123.49
Daily Pivot Point R223.75
Daily Pivot Point R324.2

Author

Haresh Menghani

Haresh Menghani is a detail-oriented professional with 10+ years of extensive experience in analysing the global financial markets.

More from Haresh Menghani
Share:

Markets move fast. We move first.

Orange Juice Newsletter brings you expert driven insights - not headlines. Every day on your inbox.

By subscribing you agree to our Terms and conditions.

Editor's Picks

EUR/USD recovers to 1.1750 region as 2025 draws to a close

Following the bearish action seen in the European session on Wednesday, EUR/USD regains its traction and recovery to the 1.1750 region. Nevertheless, the pair's volatility remains low as trading conditions thin out on the last day of the year.

GBP/USD stays weak near 1.3450 on modest USD recovery

GBP/USD remains under modest beairsh pressure and fluctuates at around 1.3450 on Wednesday. The US Dollar finds fresh demand due to the end-of-the-year position adjustments, weighing on the pair amid the pre-New Year trading lull. 

Gold retreats to $4,300 area, looks to post monthly gains

Gold stays on the back foot on the last day of 2025 and trades near $4,300, possibly pressured by profit-taking and position adjustments. Nevertheless, XAU/USD remains on track to post gains for December and extend its winning streak into a fifth consecutive month.

Bitcoin, Ethereum and XRP prepare for a potential New Year rebound

Bitcoin, Ethereum, and Ripple are holding steady on Wednesday after recording minor gains on the previous day. Technically, Bitcoin could extend gains within a triangle pattern while Ethereum and Ripple face critical overhead resistance. 

Economic outlook 2026-2027 in advanced countries: Solidity test

After a year marked by global economic resilience and ending on a note of optimism, 2026 looks promising and could be a year of solid economic performance. In our baseline scenario, we expect most of the supportive factors at work in 2025 to continue to play a role in 2026.

Crypto market outlook for 2026

Year 2025 was volatile, as crypto often is.  Among positive catalysts were favourable regulatory changes in the U.S., rise of Digital Asset Treasuries (DAT), adoption of AI and tokenization of Real-World-Assets (RWA).