|

Silver Price Analysis: XAG/USD extends pullback from 100-DMA towards $23.00

  • Silver Price retreats towards two-month low marked the last week, pressured for the second consecutive day.
  • Bearish MACD signals, failure to keep the bounce off $22.70 to lure XAG/USD sellers.
  • 200-DMA, ascending trend line from September 2022 on bear’s radar.
  • Buyers remain off the table unless the quote crosses April’s low.

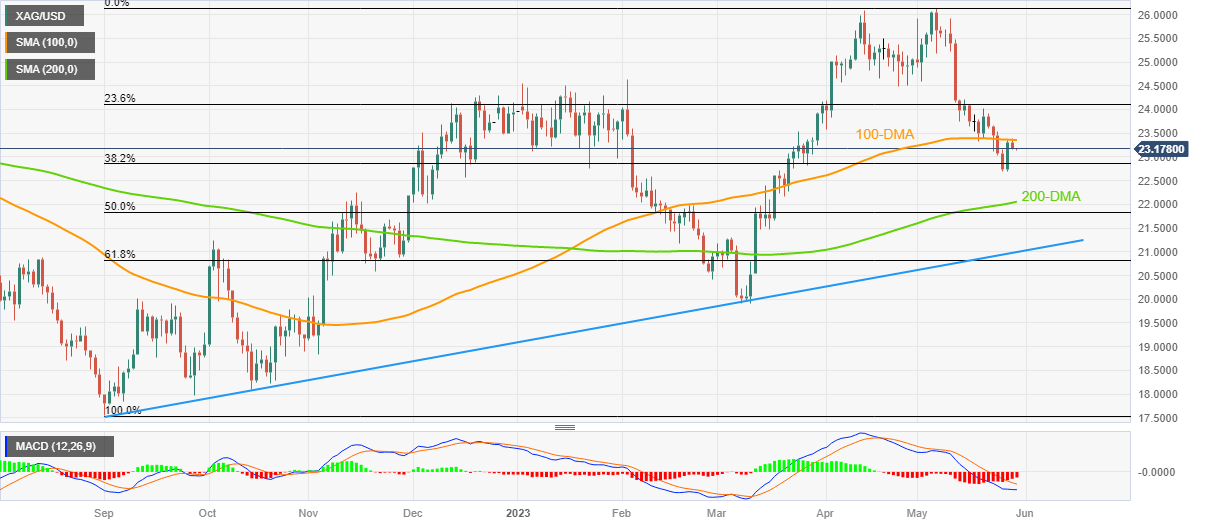
Silver Price (XAG/USD) remains depressed around the intraday low surrounding $23.15 during early Tuesday in Asia. In doing so, the bright metal drops for the second consecutive day while keeping the week-start U-turn from the 100-DMA hurdle.

Additionally favoring the Silver sellers are the downbeat MACD signals and the metal’s failure to defend Friday’s strong recovery from the $22.70 mark.

With this, the quote drops towards the $23.00 round figure ahead of revisiting the latest troughs around $22.70.

Following that, the 200-DMA level surrounding the $22.00 will gain the Silver seller’s attention. It’s worth noting, however, that an upward-sloping support line from September 2022, close to $21.00 by the press time, appears the key for the XAG/USD sellers to conquer before taking control.

On the contrary, the Silver Price recovery needs validation from the 100-DMA hurdle of around $23.35, as well as from the $24.00 round figure, ahead of challenging the final post of the XAG/USD bears around $24.50, comprising the monthly low of April.

Should the XAG/USD manage to remain firmer past $24.50, the odds of witnessing a run-up towards the yearly top marked earlier in the month around $26.15 can’t be ruled out.

Silver Price: Daily chart

Trend: Further downside expected

Additional important levels

Overview
Today last price23.16
Today Daily Change-0.02
Today Daily Change %-0.09%
Today daily open23.18
 
Trends
Daily SMA2024.29
Daily SMA5024.39
Daily SMA10023.36
Daily SMA20022.03
 
Levels
Previous Daily High23.38
Previous Daily Low23.16
Previous Weekly High23.92
Previous Weekly Low22.68
Previous Monthly High26.09
Previous Monthly Low23.57
Daily Fibonacci 38.2%23.25
Daily Fibonacci 61.8%23.3
Daily Pivot Point S123.1
Daily Pivot Point S223.02
Daily Pivot Point S322.88
Daily Pivot Point R123.32
Daily Pivot Point R223.46
Daily Pivot Point R323.54

Author

Anil Panchal

Anil Panchal

FXStreet

Anil Panchal has nearly 15 years of experience in tracking financial markets. With a keen interest in macroeconomics, Anil aptly tracks global news/updates and stays well-informed about the global financial moves and their implications.

More from Anil Panchal
Share:

Editor's Picks

EUR/USD holds ground near 1.1550 ahead of US Inflation data

EUR/USD is holding ground at around 1.1550 in the European session on Wednesday. The pair takes advantage of the profit-taking pullback in the US Dollar as traders reposition ahead of the critical US CPI inflation data. However, any upside attempts could be limited amid renewed US-Iran tensions.

GBP/USD keeps range near 1.3400, with eyes on US CPI

GBP/USD clings to minor recovery gains near 1.3400 in Wednesday's European trading, though it remains in a familiar range heading into the US CPI event risk. Traders keep an eye on developments around the Middle East crisis, which could ramp up volatility in the major.

Gold languishes near March low, below $4,200 as traders await US CPI report

Gold maintains its heavily offered tone through the first half of the European session and currently trades near its lowest level since March 23, around the $4,180-$4,175 region. Renewed hostilities between the US and Iran fuel inflationary concerns and bolster bets for more hawkish central banks.

Cardano's downtrend deepens despite on-chain bottoming signals

Cardano edges lower to $0.1600 signaling a potential extension of the 30% loss from last week. The altcoin remains under intense selling pressure, weighing on its retail support. Still, a spike in dormant supply re-entering circulation signals that the selling pressure has run its course, a pattern that often precedes a rebound.

US CPI data set to show inflation at three-year high in May, backing Fed hawkish tilt

The US Bureau of Labor Statistics will publish the May Consumer Price Index (CPI) data on Wednesday. The report is expected to show another step up in consumer inflation, driven by the persistently high Oil prices due to the ongoing crisis in the Middle East.

The US economy defies the rules: 100 days into the Oil shock and the recession signal is still missing

More than three months after the start of the Iran war and the resulting disruption to global energy markets, the US economy continues to display remarkable resilience. The conflict has triggered a sharp rise in Oil prices, reignited inflationary pressures and fueled widespread concerns about a potential economic slowdown.