|

Silver Price Analysis: XAG/USD extends 200-DMA breakdown to refresh three-month low near $22.00

  • Silver Price drops to the lowest levels in three months during five-day losing streak.
  • Clear downside break of previous support line from mid-March, 200-DMA favor XAG/USD bears.
  • Bearish MACD signals also suggest further downside of the Silver Price but RSI (14) hints at a pullback.
  • Nine-month-old ascending support line appears the key challenge for metal sellers.

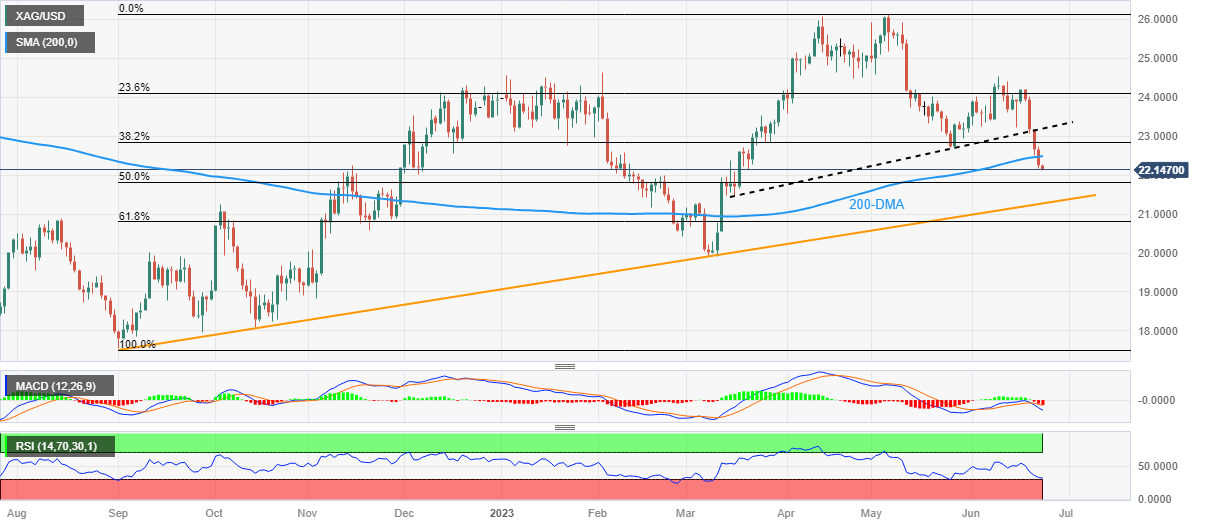
Silver Price (XAG/USD) stands on slippery grounds as it declines for the fifth consecutive day to print the lowest level since March 17 to around $22.15 amid Friday’s Asian session.

In doing so, the bright metal justifies the early-week break of an ascending support line from mid-March, now resistance around $23.20, as well as the previous day’s smashing of the 200-DMA level surrounding $22.50.

Also favoring the Silver sellers are the bearish MACD signals.

However, the oversold RSI (14) line suggests limited downside room for the XAG/USD, which in turn highlights the 50% Fibonacci retracement level of the metal’s upside from September 2022 to May 2023, close to $21.80.

Following that, an upward-sloping support line from early September and the 61.8% Fibonacci retracement level, respectively around $21.30 and $20.80, will act as the last defense of the Silver buyers.

Meanwhile, the XAG/USD run-up beyond the 200-DMA level of $22.50 and the support-turned-resistance line of around $23.20 could convince the buyers to challenge the monthly high surrounding $24.55, a break of which will push the Silver bears off the table.

Silver Price: Daily chart

Trend: Limited downside expected

Additional important levels

Overview
Today last price22.15
Today Daily Change-0.10
Today Daily Change %-0.45%
Today daily open22.25
 
Trends
Daily SMA2023.58
Daily SMA5024.25
Daily SMA10023.33
Daily SMA20022.47
 
Levels
Previous Daily High22.74
Previous Daily Low22.18
Previous Weekly High24.4
Previous Weekly Low23.22
Previous Monthly High26.14
Previous Monthly Low22.68
Daily Fibonacci 38.2%22.39
Daily Fibonacci 61.8%22.52
Daily Pivot Point S122.04
Daily Pivot Point S221.83
Daily Pivot Point S321.49
Daily Pivot Point R122.6
Daily Pivot Point R222.94
Daily Pivot Point R323.15

Author

Anil Panchal

Anil Panchal

FXStreet

Anil Panchal has nearly 15 years of experience in tracking financial markets. With a keen interest in macroeconomics, Anil aptly tracks global news/updates and stays well-informed about the global financial moves and their implications.

More from Anil Panchal
Share:

Markets move fast. We move first.

Orange Juice Newsletter brings you expert driven insights - not headlines. Every day on your inbox.

By subscribing you agree to our Terms and conditions.

Editor's Picks

EUR/USD gathers recovery momentum, trades near 1.1750

Following the correction seen in the second half of the previous week, EUR/USD gathers bullish momentum and trades in positive territory near 1.1750. The US Dollar (USD) struggles to attract buyers and supports the pair as investors await Tuesday's GDP data ahead of the Christmas holiday. 

GBP/USD rises toward 1.3450 on renewed USD weakness

GBP/USD turns north on Monday and avances to the 1.3450 region. The US Dollar (USD) stays on the back foot to begin the new week as investors adjust their positions before tomorrow's third-quarter growth data, helping the pair stretch higher.

Gold not done with record highs

Gold extends its rally in the American session on Monday and trades at a new all-time-high above $4,420, gaining nearly 2% on a daily basis. The potential for a re-escalation of the tensions in the Middle East on news of Israel planning to attack Iran allows Gold to capitalize on safe-haven flows.

Top 10 crypto predictions for 2026: Institutional demand and big banks could lift Bitcoin

Bitcoin could hit record highs in 2026, according to Grayscale and top crypto asset managers. Institutional demand and digital-asset treasury companies set to catalyze gains in Bitcoin.

Ten questions that matter going into 2026

2026 may be less about a neat “base case” and more about a regime shift—the market can reprice what matters most (growth, inflation, fiscal, geopolitics, concentration). The biggest trap is false comfort: the same trades can look defensive… right up until they become crowded.

XRP steadies above $1.90 support as fund inflows and retail demand rise

Ripple (XRP) is stable above support at $1.90 at the time of writing on Monday, after several attempts to break above the $2.00 hurdle failed to materialize last week. Meanwhile, institutional interest in the cross-border remittance token has remained steady.