Silver Price Analysis: XAG/USD edges lower towards $23.00 within weekly triangle
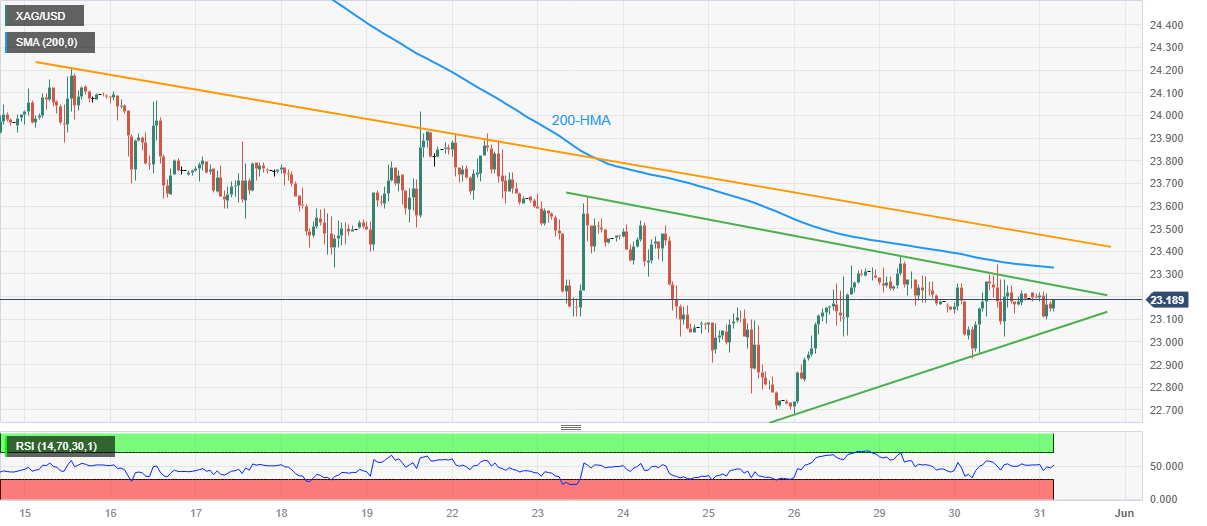
- Silver Price remains depressed within one-week-old symmetrical triangle.
- Sustained trading below 200-HMA, fortnight-long resistance line amid steady RSI favor XAG/USD sellers.
- Silver Price weakness past $23.00 can aim for November 2022 peak.

Silver Price (XAG/USD) grinds within a short-term symmetrical triangle as traders await the key risk catalysts during early Wednesday.
That said, the XAG/USD seesaws inside a one-week-old triangle formation after failing to register any clear pattern the previous day.
Though, the bullion’s sustained trading below the 200-Hour Moving Average (HMA), as well as a downward-sloping trend line from May 15, keeps the Silver bears hopeful.
Additionally, the steady RSI (14) line suggests a further zigzag of the XAG/USD price within a triangle as the bullion sellers slowly tighten their grip.
It’s worth noting that the Silver sellers, however, may need to wait for a clear downside break of the stated triangle, by smashing the $23.00 support, which in turn could direct the XAG/USD price towards the monthly low marked in the last week around $22.68.
In a case where the Silver price remains bearish past $22.68, the November 2022 peak of around $22.25 and the $22.00 round figure could lure the precious metal sellers.
On the contrary, an upside break of the stated triangle’s resistance line, around $23.30 at the latest, isn’t an open invitation to the Silver buyers as the 200-HMA and the previously stated two-week-old resistance line, respectively near $23.35 and $23.45, could play their roles of probing the XAG/USD bulls.
Following that, a run-up towards $24.00 and then to a late April low of near $24.50 can’t be ruled out.
Silver Price: Hourly chart
Trend: Further downside expected
Author

Anil Panchal
FXStreet
Anil Panchal has nearly 15 years of experience in tracking financial markets. With a keen interest in macroeconomics, Anil aptly tracks global news/updates and stays well-informed about the global financial moves and their implications.
















