|

Silver Price Analysis: XAG/USD drop as double-top chart pattern remains intact

  • Silver prices drop 1.65% as the US Dollar gains 0.15%.
  • Double-top chart pattern indicates potential further decline, with key supports at $29.00 and below.
  • US inflation data and FOMC decision on Wednesday poised to impact silver prices and the broader market.

Silver prices retreated on Tuesday and fell 1.65% as the Greenback remained in the driver’s seat and posted gains of 0.15%, ahead of crucial data to be revealed on Wednesday. US inflation figures and the FOMC’s monetary policy decision would dictate the US Dollar's faith. The XAG/USD trades at $29.27 and gains some 0.12% as Wednesday’s Asian session begins.

XAG/USD Price Analysis: Technical outlook

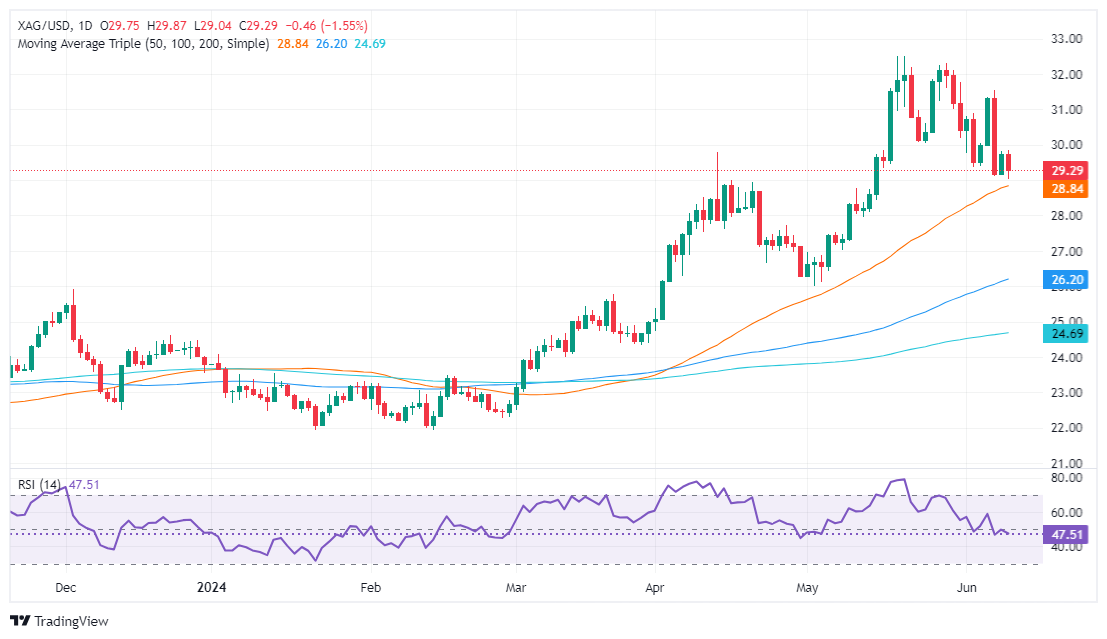
Silver's double-top chart pattern remains in play, hinting that spot prices of the grey metal will decline further. XAG/USD fell below the May 24 low of $30.05, confirming the double-top pattern.

The initial support for XAG/USD remains at $29.00, followed by the June 7 low of $29.12. Breaking below this level could lead to a drop under $29.00, then to the May 18, 2021, high turned support of $28.74, and subsequently to the June 10, 2021, high of $28.34. The final target is the double top objective at $27.80.

On the other hand, if XAG/USD moves upwards and closes above $29.00, it could challenge the May 24 low, which has turned into resistance at $30.05. Buyers are currently struggling to reclaim $30.00, which suggests potential for further downside.

XAG/USD Price Action – Daily Chart

XAG/USD

Overview
Today last price29.27
Today Daily Change-0.48
Today Daily Change %-1.61
Today daily open29.75
 
Trends
Daily SMA2030.62
Daily SMA5028.78
Daily SMA10026.13
Daily SMA20024.66
 
Levels
Previous Daily High29.82
Previous Daily Low29.14
Previous Weekly High31.55
Previous Weekly Low29.12
Previous Monthly High32.51
Previous Monthly Low26.02
Daily Fibonacci 38.2%29.56
Daily Fibonacci 61.8%29.4
Daily Pivot Point S129.31
Daily Pivot Point S228.88
Daily Pivot Point S328.63
Daily Pivot Point R130
Daily Pivot Point R230.25
Daily Pivot Point R330.69

Author

Christian Borjon Valencia

Markets analyst, news editor, and trading instructor with over 14 years of experience across FX, commodities, US equity indices, and global macro markets.

More from Christian Borjon Valencia
Share:

Editor's Picks

AUD/USD eyes 0.7150 barrier nine-day EMA

AUD/USD inches higher after registering modest losses in the previous day, trading around 0.7130 during the Asian hours. The technical analysis of the daily chart indicates that the pair is moving sideways within the rectangle pattern, suggesting a consolidation as neither the bulls nor the bears have enough momentum to take control of the market.

USD/JPY trades below 160.00 intervention threshold; bullish bias intact

The USD/JPY pair attracts some sellers during the Asian session amid fears that authorities will step in again to prop up the Japanese Yen. Furthermore, the Israel-Lebanon truce prompts some profit-taking around the US Dollar and exerts downward pressure on the currency pair.

Gold puts its 200-day SMA to the test near $4,420

Gold keeps the bullish stance in place in the latter part of Thursday’s session, although a convincing break above the key $4,500 mark per troy ounce still remains elusive. The precious metal’s advance comes amid the resurgence of some selling interest around the Greenback, improving risk sentiment, and declining US Treasury yields across the board.

Bitcoin’s massive storm is back: Why the sell-off is far from over

Bitcoin price action over the last few weeks has felt less like a normal, healthy correction and more like a slow grinding crash that continues to wreak havoc on holdings and trading accounts. And everything suggests that the dramatic crash isn’t over.

Nonfarm payrolls: Testing the limits of Fed policy patience

The upcoming nonfarm payrolls report for May will provide the final update on the US labor market before Kevin Warsh attends his first policy meeting as the new Fed Chair later this month.

Recession on paper: What really moves the Canadian Loonie now?

Statistics Canada handed the headline writers a gift and the analysts a headache. Real GDP shrank 0.1% on an annualized basis in the first quarter, and with the fourth quarter of 2025 revised down to a 1.0% contraction, that is two negative quarters in a row, the textbook definition of a technical recession and Canada's first since the pandemic.