|

Silver Price Analysis: XAG/USD dips below $23.00 and the 200-day EMA as US yields surge

  • Silver slides 1.82% as soaring US Treasury bond yields and heightened odds of a Fed rate hike in July weigh heavy.
  • Silver’s drop below the 200-day EMA may trigger further losses unless the $22.53 swing low offers a reprieve.
  • A possible rebound could see Silver testing the $23.00 mark and, if breached, a recovery to the 20-day EMA at $23.06.

Silver price dropped below the $23.00 mark as US Treasury bond yield soared after the latest Fed’s minutes and a tranche of US economic data increased the odds for Fed’s July rate hike. At the time of writing, the XAG/USD is trading at $22.69, down 1.82%.

XAG/USD Price Analysis: Technical outlook

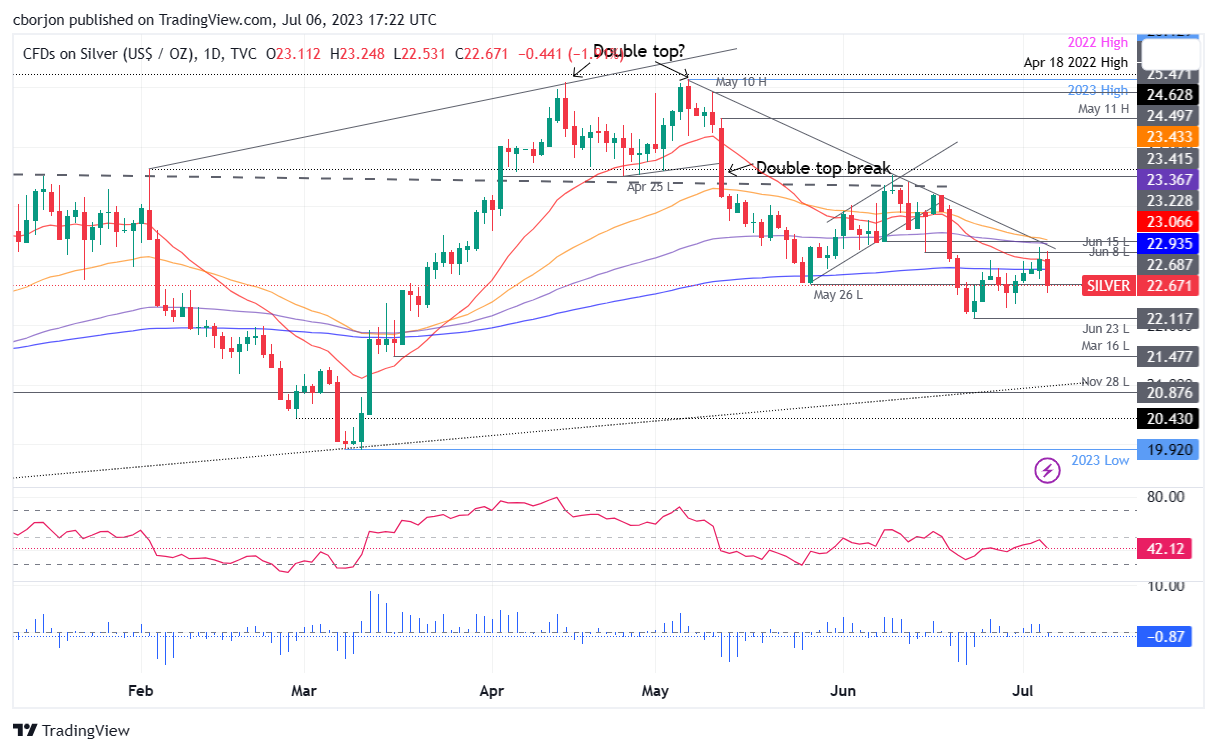
XAG/USD turned bearish during Thursday’s session. Silver’s price dropping below the 200-day Exponential Moving Average (EMA) at $22.93 opened the door for further losses, though so far failed to crack the May 26 swing low of $22.53.

If XAG/USD stays above the latter, the white metal could consolidate at around the $22.50-$22.90 range. Otherwise, Silver’s sliding below the bottom of the range will expose the June 22 swing low of $22.11 before testing $22.00. Once cleared, the XAG/USD next support will be the March 16 swing low of $21.47.

Conversely, if XAG/USD stages a comeback and reclaims the 200-day EMA, the XAG/USD’s next resistance will be the $23.00 psychological level. A breach of the latter will increase the odds for a recovery to the 20-day EMA at $23.06.

XAG/USD Price Action – Daily chart

XAG/USD Daily chart

XAG/USD

Overview
Today last price22.7
Today Daily Change-0.43
Today Daily Change %-1.86
Today daily open23.13
 
Trends
Daily SMA2023.27
Daily SMA5023.82
Daily SMA10023.38
Daily SMA20022.64
 
Levels
Previous Daily High23.31
Previous Daily Low22.77
Previous Weekly High23.1
Previous Weekly Low22.28
Previous Monthly High24.53
Previous Monthly Low22.11
Daily Fibonacci 38.2%23.1
Daily Fibonacci 61.8%22.98
Daily Pivot Point S122.83
Daily Pivot Point S222.53
Daily Pivot Point S322.29
Daily Pivot Point R123.37
Daily Pivot Point R223.61
Daily Pivot Point R323.9

Author

Christian Borjon Valencia

Markets analyst, news editor, and trading instructor with over 14 years of experience across FX, commodities, US equity indices, and global macro markets.

More from Christian Borjon Valencia
Share:

Editor's Picks

AUD/USD stays bid above 0.7100 on Australian trade data, Mideast optimism

AUD/USD clings to minor recovery gains above 0.7100 in the Asian session on Thursday as a new Israel-Lebanon ceasefire keeps a lid on the safe-haven US Dollar. Meanwhile, strong AustralianTrade Balane data also help the Aussie pair sustain the bounce from weekly lows.

USD/JPY hovers near the 160.00 intervention threshold on Mideast tensions

USD/JPY struggles to find acceptance above 160.00 and retreats from a one-month high in the Asian session on Thursday amid fears that authorities will step in again to prop up the Japanese Yen. Furthermore, a new Israel-Lebanon ceasefire caps the US Dollar and supports the currency pair. However, renewed US-Iran tensions keep the downside limited in the Greenback and the pair.

Gold rebounds from one-week low as Israel-Lebanon truce pressures safe-haven USD

Gold gains some positive traction on Thursday and climbs to the $4,475 area during the Asian session, reversing a major part of the previous day's slide to a one-week low. The Israel-Lebanon truce prompts some profit-taking around the US Dollar and supports the commodity. 


Hyperliquid: ETF demand, capital rotation fuel HYPE rally as Bitcoin melts

Hyperliquid price sustains an upward trend near its all-time high of $75.76 on Thursday after posting 80% gains in May, while Bitcoin (BTC) retraces below $65,000, triggering a market-wide panic.

Kevin Warsh takes the Fed helm: What it means for the US Dollar
The Federal Reserve moves away from the highly predictable "forward guidance" model of the Jerome Powell era to a new “Kevin Warsh environment”, characterized by less communication, more policy surprises, and an increased focus on the Fed's complex balance sheet.
Recession on paper: What really moves the Canadian Loonie now?

Statistics Canada handed the headline writers a gift and the analysts a headache. Real GDP shrank 0.1% on an annualized basis in the first quarter, and with the fourth quarter of 2025 revised down to a 1.0% contraction, that is two negative quarters in a row, the textbook definition of a technical recession and Canada's first since the pandemic.