|

Silver Price Analysis: XAG/USD consolidates near $23.65 area, below descending trend-line hurdle

  • Silver oscillates in a narrow trading band for the second successive day on Friday.
  • Bullish oscillators on the daily chart support prospects for some short-term gains.
  • A breakout through an descending trend line is needed to confirm the bullish bias.

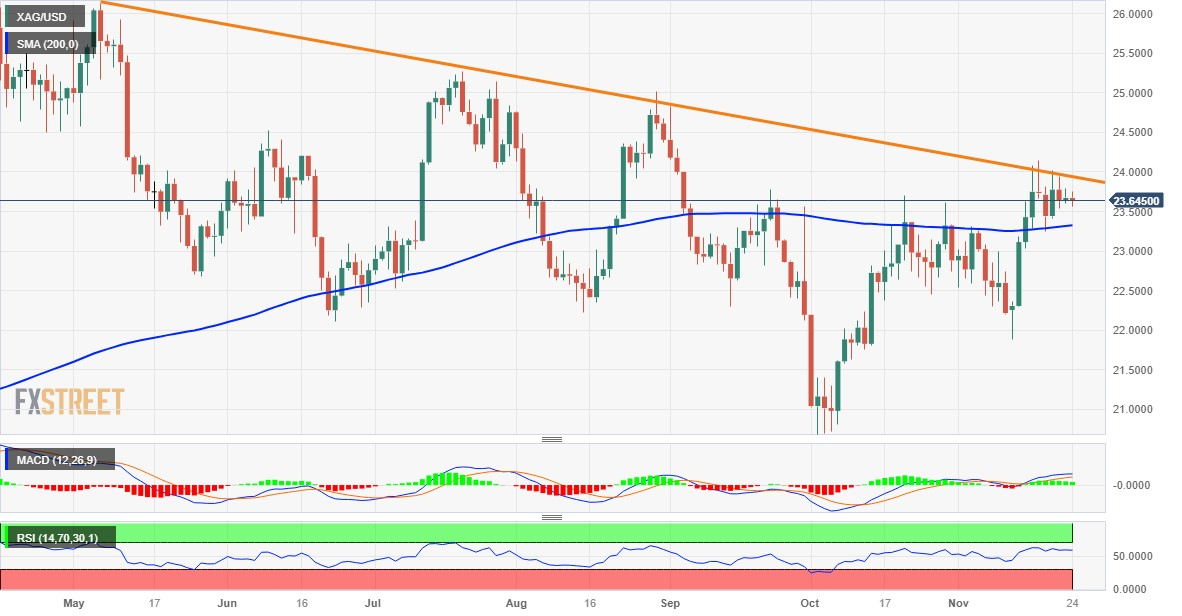
Silver (XAG/USD) continues with its struggle to gain any meaningful traction and seesaws between tepid gains/minor losses for the second successive day on Friday. The white metal currently trades around the $23.65 region, nearly unchanged for the day and below a downward-sloping trend line resistance extending from the May swing high.

The aforementioned barrier, currently pegged near the $24.00 round figure, should act as a key pivotal point and help determine the next leg of a directional move for the XAG/USD. Against the backdrop of the recent sustained strength beyond the 200-day Simple Moving Average (SMA), positive oscillators on the daily chart support prospects for an eventual breakout through the said resistance.

A sustained strength beyond will be seen as a fresh trigger for bulls. The subsequent move-up should allow the XAG/USD to surpass the $24.20-$24.25 intermediate hurdle and make a fresh attempt to conquer the $25.00 psychological mark. Some follow-through buying beyond the $25.15-$25.20 region will set the stage for a move towards reclaiming the $26.00 mark for the first time since May.

On the flip side, the 200-day SMA, currently around the $23.35 region, might continue to protect the immediate downside. Any further decline might still be seen as a buying opportunity and remain limited near the $23.00 mark. A convincing break below the latter, however, might prompt aggressive technical selling and drag the XAG/USD towards the $22.35-$22.30 zone en route to the $22.00 mark.

Silver daily chart

fxsoriginal

technical levels to watch

XAG/USD

Overview
Today last price23.66
Today Daily Change-0.01
Today Daily Change %-0.04
Today daily open23.67
 
Trends
Daily SMA2023.1
Daily SMA5022.75
Daily SMA10023.24
Daily SMA20023.32
 
Levels
Previous Daily High23.79
Previous Daily Low23.6
Previous Weekly High24.15
Previous Weekly Low21.88
Previous Monthly High23.7
Previous Monthly Low20.68
Daily Fibonacci 38.2%23.72
Daily Fibonacci 61.8%23.67
Daily Pivot Point S123.58
Daily Pivot Point S223.5
Daily Pivot Point S323.39
Daily Pivot Point R123.78
Daily Pivot Point R223.88
Daily Pivot Point R323.97

(This story was corrected on November 24 at 09:50 GMT to say, in the third bullet point, that a breakout in the descending trend line is needed, not ascending trend line.)

Author

Haresh Menghani

Haresh Menghani is a detail-oriented professional with 10+ years of extensive experience in analysing the global financial markets.

More from Haresh Menghani
Share:

Markets move fast. We move first.

Orange Juice Newsletter brings you expert driven insights - not headlines. Every day on your inbox.

By subscribing you agree to our Terms and conditions.

Editor's Picks

EUR/USD bounces toward 1.1750 as US Dollar loses strength

EUR/USD returned to the 1.1750 price zone in the American session on Friday, despite falling Wall Street, which indicates risk aversion. Trading conditions remain thin following the New Year holiday and ahead of the weekend, with the focus shifting to US employment and European data scheduled for next week.

GBP/USD nears 1.3500, holds within familiar levels

After testing 1.3400 on the last day of 2025, GBP/USD managed to stage a rebound. Nevertheless, the pair finds it difficult to gather momentum and trades with modest intraday gains at around 1.3490 as market participants remain in holiday mood.

Gold trims intraday gains, approaches $4,300

Gold retreated sharply from the $4,400  area and trades flat for the day in the $4,320 price zone. Choppy trading conditions exacerbated the intraday decline, although XAU/USD bearish case is out of the picture, considering growing expectations for a dovish Fed and persistent geopolitical tensions.

Cardano gains early New Year momentum, bulls target falling wedge breakout

Cardano kicks off the New Year on a positive note and is extending gains, trading above $0.36 at the time of writing on Friday. Improving on-chain and derivatives data point to growing bullish interest, while the technical outlook keeps an upside breakout in focus.

Economic outlook 2026-2027 in advanced countries: Solidity test

After a year marked by global economic resilience and ending on a note of optimism, 2026 looks promising and could be a year of solid economic performance. In our baseline scenario, we expect most of the supportive factors at work in 2025 to continue to play a role in 2026.

Crypto market outlook for 2026

Year 2025 was volatile, as crypto often is.  Among positive catalysts were favourable regulatory changes in the U.S., rise of Digital Asset Treasuries (DAT), adoption of AI and tokenization of Real-World-Assets (RWA).