Silver Price Analysis: XAG/USD consolidates around 100-day SMA, not out of the woods yet
- Silver oscillates in a narrow trading band around the 100-day SMA on Wednesday.
- The setup still favours bearish traders and supports prospects for further losses.
- A sustained strength beyond the $24.25-30 hurdle could offset the negative bias.

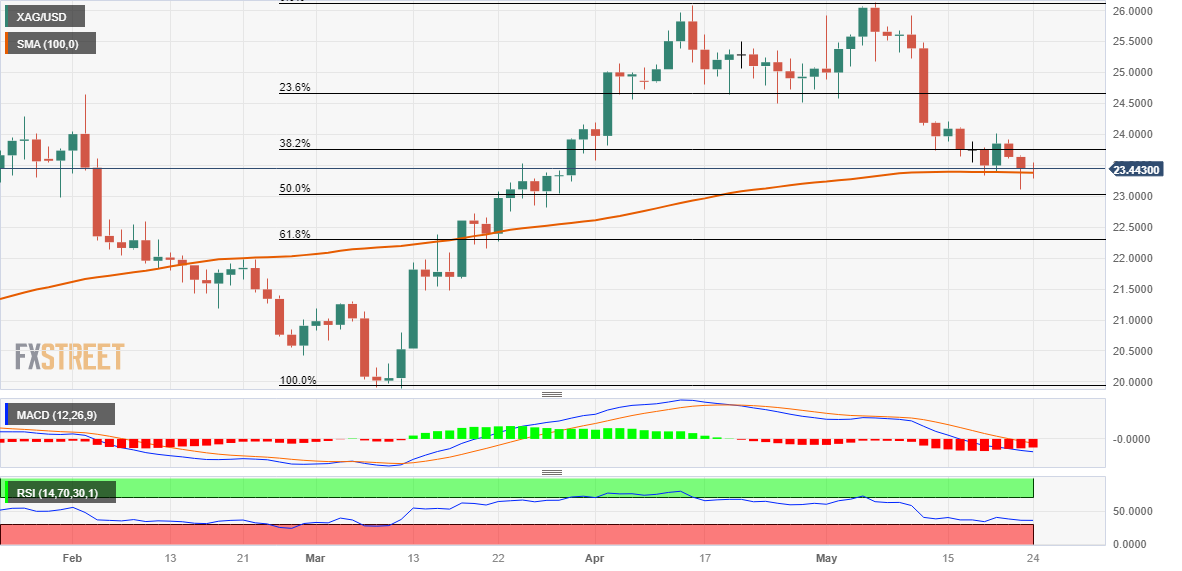
Silver struggles to capitalize on the overnight bounce from the vicinity of the $23.00 mark or the 50% Fibonacci retracement level of the March-May rally - and oscillates in a narrow trading band on Wednesday. The white metal seesaws between tepid gains/minor losses through the first half of the European session and currently trades just below mid-$23.00s, nearly unchanged for the day.
Against the backdrop of the recent failures near the $24.00 mark and the overnight slide below the technically significant 100-day Simple Moving Average (SMA) favours bearish traders. Moreover, technical indicators on the daily chart are holding deep in the negative territory and are still far from being in the oversold zone. This, in turn, suggests that the path of least resistance for the XAG/USD is to the downside and supports prospects for an extension of the retracement slide from over a one-year top, around the $26.15 region touched earlier this month.
Some follow-through selling below the $23.00 mark, or the 50% Fibo. level will reaffirm the negative outlook. The XAG/USD might then accelerate the fall towards intermediate support near the $22.60-$22.55 region before eventually dropping to the 61.8% Fibo. level, around the $22.25-$22.20 region. This is followed by the $22.00 mark, which if broken decisively will set the stage for a further near-term depreciating move.
On the flip side, any subsequent recovery is more likely to attract fresh sellers and remain capped near the 38.2% Fibo. level, around the $23.75 area. This is closely followed by the $24.00 round-figure mark and resistance near the $24.20-$24.25 region. A sustained strength beyond the latter might negate the near-term bearish outlook and prompt an aggressive short-covering rally. This should allow the XAG/USD to aim back to reclaim the $25.00 psychological mark.
Silver daily chart
Key levels to watch
Author

Haresh Menghani
FXStreet
Haresh Menghani is a detail-oriented professional with 10+ years of extensive experience in analysing the global financial markets.