Silver Price Analysis: XAG/USD climbs as geopolitical tensions arise, firm at $28.00
- Silver price rallies above $28.00, bouncing from daily low of $27.63 amid Israel-Hezbollah conflict.
- Technical outlook shows bearish RSI; support levels at $28.00 and July 29 low of $27.31.
- Resistance at 100-DMA ($28.54) and 50-DMA ($29.93) could be tested if gains continue.

Silver's price rallied sharply by more than 1.80% on Tuesday amid rising tensions in the Middle East after Israel retaliated against Hezbollah’s strike over the weekend. Although US data revealed solid results, the non-yielding metal advanced, as the XAG/USD traded at $28.17 after hitting a daily low of $27.63.
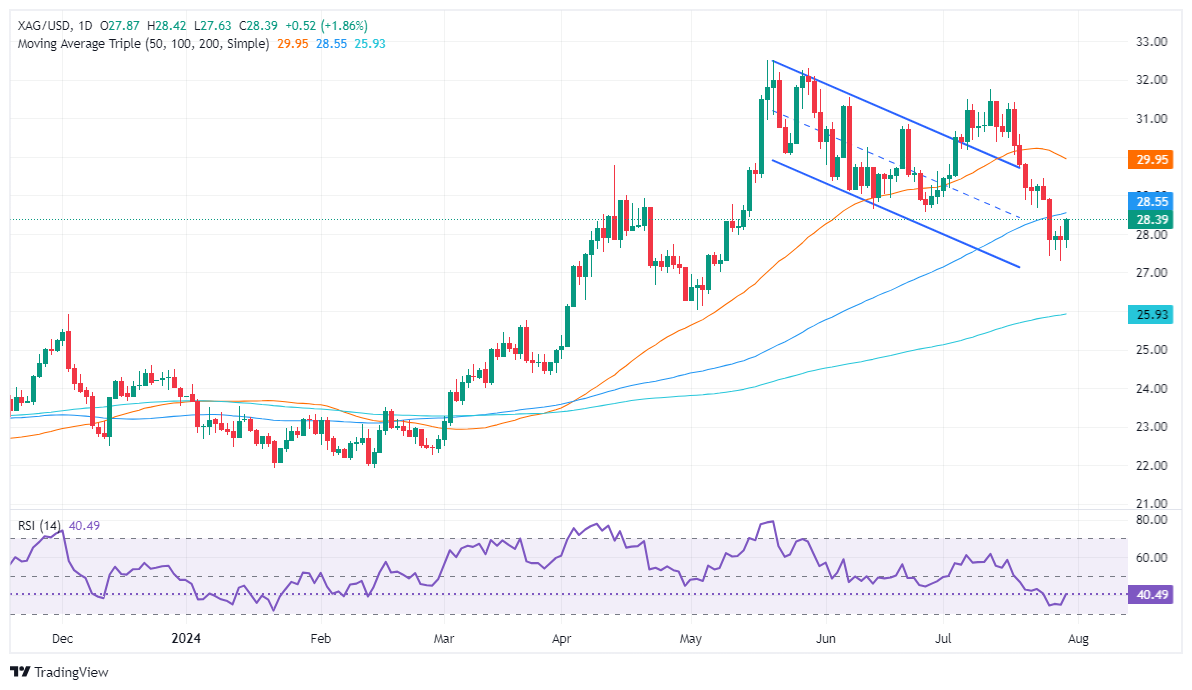
XAG/USD Price Analysis: Technical outlook
Silver seems to have consolidated at around $28.50 after diving into a two-month low of $27.31. The grey metal fall below the $29.00 figure and clearing support levels like the 50 and 100-day moving averages (DMAs) changed its bias from neutral upwards to downwards. This is confirmed by the Relative Strength Index (RSI) hovering at bearish territory, which could pave the way for further losses.
If XAG/USD drops below $28.00, this can exacerbate a drop to the July 29 low of $27.31. A breach of the latter will expose $27.00, followed by the 200-DMA at $25.92.
Conversely, if XAG/USD extends its recent gains above the 100-DMA at $28.54, the $29.00 figure will be exposed. On further strength, the next resistance would be the 50-DMA at $29.93, before testing the $30.00 mark.
XAG/USD Price Action – Daily Chart
Silver FAQs
Silver is a precious metal highly traded among investors. It has been historically used as a store of value and a medium of exchange. Although less popular than Gold, traders may turn to Silver to diversify their investment portfolio, for its intrinsic value or as a potential hedge during high-inflation periods. Investors can buy physical Silver, in coins or in bars, or trade it through vehicles such as Exchange Traded Funds, which track its price on international markets.
Silver prices can move due to a wide range of factors. Geopolitical instability or fears of a deep recession can make Silver price escalate due to its safe-haven status, although to a lesser extent than Gold's. As a yieldless asset, Silver tends to rise with lower interest rates. Its moves also depend on how the US Dollar (USD) behaves as the asset is priced in dollars (XAG/USD). A strong Dollar tends to keep the price of Silver at bay, whereas a weaker Dollar is likely to propel prices up. Other factors such as investment demand, mining supply – Silver is much more abundant than Gold – and recycling rates can also affect prices.
Silver is widely used in industry, particularly in sectors such as electronics or solar energy, as it has one of the highest electric conductivity of all metals – more than Copper and Gold. A surge in demand can increase prices, while a decline tends to lower them. Dynamics in the US, Chinese and Indian economies can also contribute to price swings: for the US and particularly China, their big industrial sectors use Silver in various processes; in India, consumers’ demand for the precious metal for jewellery also plays a key role in setting prices.
Silver prices tend to follow Gold's moves. When Gold prices rise, Silver typically follows suit, as their status as safe-haven assets is similar. The Gold/Silver ratio, which shows the number of ounces of Silver needed to equal the value of one ounce of Gold, may help to determine the relative valuation between both metals. Some investors may consider a high ratio as an indicator that Silver is undervalued, or Gold is overvalued. On the contrary, a low ratio might suggest that Gold is undervalued relative to Silver.
Author

Christian Borjon Valencia
FXStreet
Markets analyst, news editor, and trading instructor with over 14 years of experience across FX, commodities, US equity indices, and global macro markets.


