|

Silver Price Analysis: XAG/USD bulls run out of steam, sellers need validation from $24.30

  • Silver price stays depressed after downbeat week-start, grinds near highest levels in a year.
  • Overbought RSI conditions, receding bullish bias of MACD signals lure bears.
  • Failure to cross ascending resistance line from late 2022 adds strength to bearish bias.
  • Multiple support lines from March restrict immediate downside ahead of highlighting 100-DMA support.

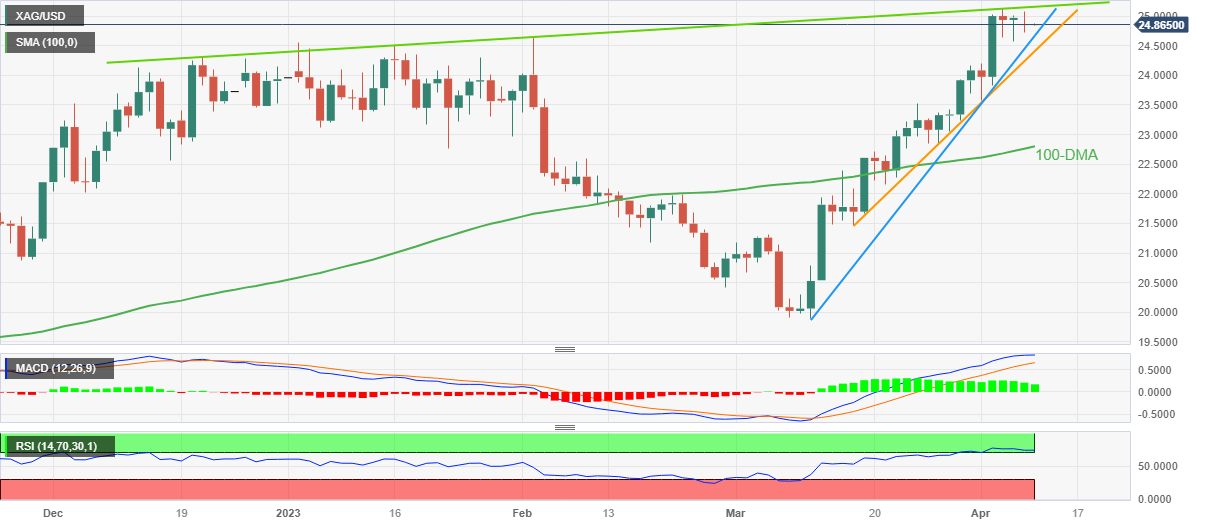
Silver price (XAG/USD) makes rounds to $24.80-85 during the early hours of Tuesday’s Asian session, following a downbeat start of the week. Even so, the bright metal seesaws around the highest levels since late April 2022 marked in the last week.

That said, the commodity buyers appear running out of steam of late as the RSI (14) turns over overbought and the MACD signals also retreat within the bullish area.

Adding strength to the downside bias is the XAG/USD’s failure to cross an upward-sloping resistance line from late December 2022, close to $25.15 by the press time.

However, two ascending support lines from the previous month, respectively near $24.65 and $24.30, restrict the short-term downside of the Silver price.

Following that, the precious metal’s slump towards the $21.80-75 support zone comprising January’s low and the 100-DMA can’t be ruled out.

Meanwhile, an upside clearance of the aforementioned resistance line, close to $25.15, opens the door for the XAG/USD rally towards the April 2022 peak of $26.22.

In a case where the Silver buyers keep the reins past $26.22, the previous yearly high of around $26.95 and the $27.00 round figure will gain the market’s attention.

Silver price: Daily chart

Trend: Further downside expected

Additional important levels

Overview
Today last price24.85
Today Daily Change-0.12
Today Daily Change %-0.48%
Today daily open24.97
 
Trends
Daily SMA2023.05
Daily SMA5022.29
Daily SMA10022.72
Daily SMA20021.11
 
Levels
Previous Daily High25
Previous Daily Low24.56
Previous Weekly High25.14
Previous Weekly Low23.57
Previous Monthly High24.16
Previous Monthly Low19.9
Daily Fibonacci 38.2%24.84
Daily Fibonacci 61.8%24.73
Daily Pivot Point S124.69
Daily Pivot Point S224.41
Daily Pivot Point S324.25
Daily Pivot Point R125.13
Daily Pivot Point R225.29
Daily Pivot Point R325.57

Author

Anil Panchal

Anil Panchal

FXStreet

Anil Panchal has nearly 15 years of experience in tracking financial markets. With a keen interest in macroeconomics, Anil aptly tracks global news/updates and stays well-informed about the global financial moves and their implications.

More from Anil Panchal
Share:

Editor's Picks

GBP/USD appears well offered near 1.3160

GBP/USD builds on Tuesday’s losses, although it now manages to pick up some pace and bounce off earlier multi-month troughs near 1.3140. The Greenback’s solid performance and continued political turmoil in the UK are keeping Cable under persistent pressure, with little sign of a meaningful recovery.

EUR/USD rebounds from lows, back to 1.1360

After bottoming out near 1.1320, EUR/USD gathers some traction and reclaims the 1.1350-1.1360 band as the NA session draws to a close on Wednesday. The pair’s drop to multi-month lows comes in response to the continuous leg higher in the US Dollar, which remains propped up by hawkish Fed expectations and uncertainty over the outcome of US-Iran peace negotiations.

Gold pressured near fresh 2026 lows

Gold accelerates its decline and gyrates around the key $4,000 mark per troy ounce on Wednesday, its lowest level since November 2025. In the meantime, tighter-for-longer Fed expectations and a broadly firmer US Dollar continue to weigh on the yellow metal, while uncertainty surrounding a potential US-Iran peace agreement has done little to revive demand for the safe haven space.

XRP nears key support as Fed hike risks suppress demand
Ripple (XRP) continues to face significant selling pressure, trading around $1.05 at the time of writing on Wednesday. This decline mirrors the broader weakness in the crypto market, exacerbated by mounting macroeconomic headwinds and persistent geopolitical uncertainties.
US-Iran talks: The next 60 days will decide where Oil prices go next
Oil markets received some encouraging news after weeks of rising tensions in the Middle East. But let’s not get ahead of ourselves: we’re far from victory, and markets just seem to have priced out the worst-case scenario. The US and Iran have reportedly made "substantive progress" in talks in Switzerland and agreed on a framework for working toward a broader deal within 60 days.
Regime change: Inside Kevin Warsh's first move to make the Fed unreadable on purpose

The rate did not move. That was the least interesting thing about Kevin Warsh's first meeting in charge of the Fed. The FOMC held its benchmark at 3.50%-3.75% for the fourth straight meeting, exactly as priced, and then the new chair used his first press conference to dismantle the machinery the market has leaned on for a decade.