Silver Price Analysis: XAG/USD bulls retain control near multi-month peak, above $25.00


  • Silver attracted dip-buying on Tuesday and recovered a major part of the overnight losses.
  • The set-up remains tilted in favour of bullish and supports prospects for additional gains.
  • Dips below the $25.00 mark could still be seen as a buying opportunity and remain limited.

Silver regained positive traction on Tuesday and reversed a major part of the overnight retracement slide from a more than a three-month peak. The white metal built on its steady intraday ascent and climbed to a fresh daily top, around the $25.25 region heading into the North American session.

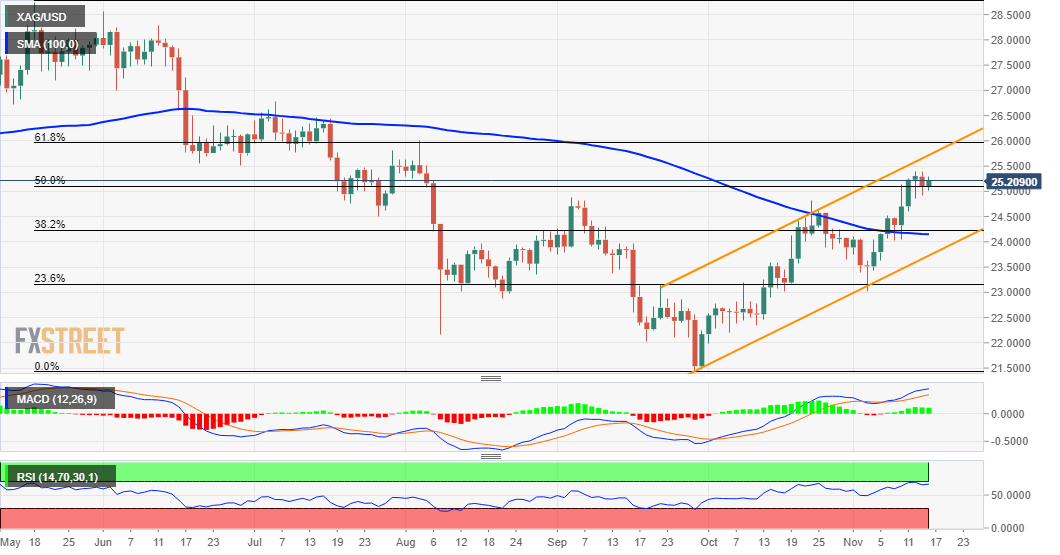
Looking at the broader picture, the recent strong recovery from YTD lows, around the $21.40 region touched in September, has been along an upward sloping channel. This points to a well-established short-term bullish trend and supports prospects for an extension of the appreciating move.

Apart from this, last week's sustained breakout through 100-day SMA/38.2% Fibo. confluence barrier, the $24.50 supply zone adds credence to the positive outlook. Moreover, acceptance above the 50% Fibo. level, around the key $25.00 psychological mark reaffirms the constructive set-up for the XAG/USD.

With oscillators on the daily chart holding in the bullish territory and still far from being in the overbought zone, a subsequent move towards the $25.55-60 region, en-route the $26.00 mark, remains a distinct possibility. The latter coincides with the 61.8% Fibo. and should act as a strong barrier.

On the flip side, any meaningful corrective pullback might continue to attract some dip-buying near the $25.00 mark. This, in turn, should help limit the downside near the $24.50 resistance breakpoint. Failure to defend the mentioned support could drag the XAG/USD towards the $24.00 round-figure mark.

Silver daily chart

fxsoriginal

Technical levels to watch

XAG/USD

Overview
Today last price 25.24
Today Daily Change 0.14
Today Daily Change % 0.56
Today daily open 25.1
 
Trends
Daily SMA20 24.27
Daily SMA50 23.47
Daily SMA100 24.15
Daily SMA200 25.36
 
Levels
Previous Daily High 25.38
Previous Daily Low 24.91
Previous Weekly High 25.39
Previous Weekly Low 24.03
Previous Monthly High 24.83
Previous Monthly Low 22
Daily Fibonacci 38.2% 25.09
Daily Fibonacci 61.8% 25.2
Daily Pivot Point S1 24.88
Daily Pivot Point S2 24.66
Daily Pivot Point S3 24.41
Daily Pivot Point R1 25.35
Daily Pivot Point R2 25.6
Daily Pivot Point R3 25.82


Share: Feed news

Information on these pages contains forward-looking statements that involve risks and uncertainties. Markets and instruments profiled on this page are for informational purposes only and should not in any way come across as a recommendation to buy or sell in these assets. You should do your own thorough research before making any investment decisions. FXStreet does not in any way guarantee that this information is free from mistakes, errors, or material misstatements. It also does not guarantee that this information is of a timely nature. Investing in Open Markets involves a great deal of risk, including the loss of all or a portion of your investment, as well as emotional distress. All risks, losses and costs associated with investing, including total loss of principal, are your responsibility. The views and opinions expressed in this article are those of the authors and do not necessarily reflect the official policy or position of FXStreet nor its advertisers. The author will not be held responsible for information that is found at the end of links posted on this page.

If not otherwise explicitly mentioned in the body of the article, at the time of writing, the author has no position in any stock mentioned in this article and no business relationship with any company mentioned. The author has not received compensation for writing this article, other than from FXStreet.

FXStreet and the author do not provide personalized recommendations. The author makes no representations as to the accuracy, completeness, or suitability of this information. FXStreet and the author will not be liable for any errors, omissions or any losses, injuries or damages arising from this information and its display or use. Errors and omissions excepted.

The author and FXStreet are not registered investment advisors and nothing in this article is intended to be investment advice.

Recommended content


Recommended content

Editors’ Picks

EUR/USD climbs to 10-day highs above 1.0700

EUR/USD climbs to 10-day highs above 1.0700

EUR/USD gained traction and rose to its highest level in over a week above 1.0700 in the American session on Tuesday. The renewed US Dollar weakness following the disappointing PMI data helps the pair stretch higher.

EUR/USD News

GBP/USD extends recovery beyond 1.2400 on broad USD weakness

GBP/USD extends recovery beyond 1.2400 on broad USD weakness

GBP/USD gathered bullish momentum and extended its daily rebound toward 1.2450 in the second half of the day. The US Dollar came under heavy selling pressure after weaker-than-forecast PMI data and fueled the pair's rally. 

GBP/USD News

Gold trims losses on disappointing US PMIs

Gold trims losses on disappointing US PMIs

Gold (XAU/USD) reclaims part of the ground lost and pares initial losses on the back of further weakness in the Greenback following disheartening US PMIs prints.

Gold News

Here’s why Ondo price hit new ATH amid bearish market outlook Premium

Here’s why Ondo price hit new ATH amid bearish market outlook

Ondo price shows no signs of slowing down after setting up an all-time high (ATH) at $1.05 on March 31. This development is likely to be followed by a correction and ATH but not necessarily in that order.

Read more

Germany’s economic come back

Germany’s economic come back

Germany is the sick man of Europe no more. Thanks to its service sector, it now appears that it will exit recession, and the economic future could be bright. The PMI data for April surprised on the upside for Germany, led by the service sector.

Read more

Forex MAJORS

Cryptocurrencies

Signatures