|

Silver Price Analysis: XAG/USD bulls need to make it through $22.30 support-turned-hurdle

  • Silver regains positive traction on Friday and climbs back closer to a near two-week high.
  • Neutral oscillators on the daily chart warrant some caution for aggressive bullish traders.
  • Any meaningful corrective slide is likely to attract fresh buyers near the $21.60-55 region.

Silver builds on its intraday gains through the first half of the European session on Friday and jumps back closer to a nearly two-week high touched the previous day, though remains below the $22.30 strong horizontal support breakpoint.

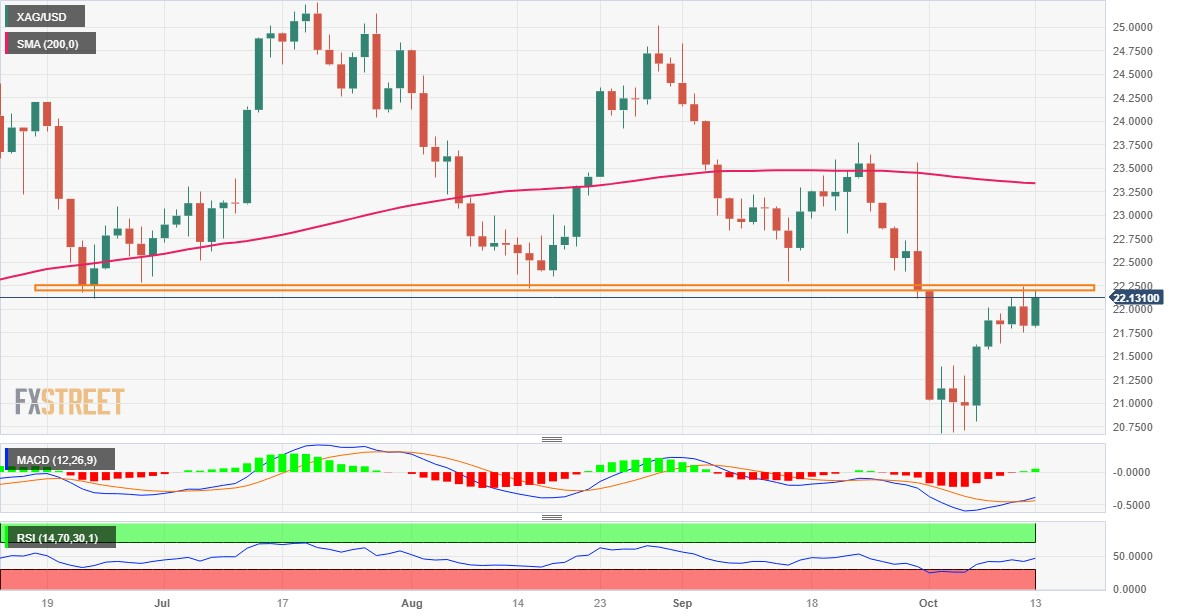
Neutral technical indicators on the daily chart, meanwhile, make it prudent to wait for some follow-through buying beyond the aforementioned support-turned-resistance before positioning for any further appreciating move. The XAG/USD might then accelerate the momentum towards reclaiming the $23.00 mark before aiming to challenge the very important 200-day Simple Moving Average (SMA), currently pegged around the $23.35 area.

The latter should act as a key pivotal point for short-term traders, which if cleared decisively will set the stage for an extension of the recent recovery move from the $20.70-$20.65 region, or a multi-month low touched last week. The subsequent move up has the potential to lift the XAG/USD towards the next relevant hurdle near the $23.75-$23.80 region (September 22 high) en route to the $24.00 round figure and the $24.30-$24.35 resistance zone.

On the flip side, the $21.75 horizontal support might continue to protect the immediate downside ahead of the $21.60-$21.55 zone 
or the weekly low. Some follow-through selling could drag the XAG/USD back towards a multi-day-old trading range resistance breakpoint, turned support, around the $21.3-$21.30 region en route to the $21.00 mark. The downward trajectory could get extended towards the $20.70-$20.65 region, or a seven-month low.

Silver daily chart

fxsoriginal

Technical levels to watch

XAG/USD

Overview
Today last price22.14
Today Daily Change0.31
Today Daily Change %1.42
Today daily open21.83
 
Trends
Daily SMA2022.32
Daily SMA5022.94
Daily SMA10023.33
Daily SMA20023.35
 
Levels
Previous Daily High22.24
Previous Daily Low21.75
Previous Weekly High22.2
Previous Weekly Low20.68
Previous Monthly High24.82
Previous Monthly Low22.12
Daily Fibonacci 38.2%21.94
Daily Fibonacci 61.8%22.05
Daily Pivot Point S121.64
Daily Pivot Point S221.45
Daily Pivot Point S321.15
Daily Pivot Point R122.13
Daily Pivot Point R222.43
Daily Pivot Point R322.61

Author

Haresh Menghani

Haresh Menghani is a detail-oriented professional with 10+ years of extensive experience in analysing the global financial markets.

More from Haresh Menghani
Share:

Markets move fast. We move first.

Orange Juice Newsletter brings you expert driven insights - not headlines. Every day on your inbox.

By subscribing you agree to our Terms and conditions.

Editor's Picks

EUR/USD moves sideways below 1.1800 on Christmas Eve

EUR/USD struggles to find direction and trades in a narrow channel below 1.1800 after posting gains for two consecutive days. Bond and stock markets in the US will open at the usual time and close early on Christmas Eve, allowing the trading action to remain subdued. 

GBP/USD keeps range around 1.3500 amid quiet markets

GBP/USD keeps its range trade intact at around 1.3500 on Wednesday. The Pound Sterling holds the upper hand over the US Dollar amid pre-Christmas light trading as traders move to the sidelines heading into the holiday season. 

Gold retreats from record highs, trades below $4,500

Gold retreats after setting a new record-high above $4,520 earlier in the day and trades in a tight range below $4,500 as trading volumes thin out ahead of the Christmas break. The US Dollar selling bias remains unabated on the back of dovish Fed expectations, which continues to act as a tailwind for the bullion amid persistent geopolitical risks.

Bitcoin slips below $87,000 as ETF outflows intensify, whale participation declines

Bitcoin price continues to trade around $86,770 on Wednesday, after failing to break above the $90,000 resistance. US-listed spot ETFs record an outflow of $188.64 million on Tuesday, marking the fourth consecutive day of withdrawals.

Economic outlook 2026-2027 in advanced countries: Solidity test

After a year marked by global economic resilience and ending on a note of optimism, 2026 looks promising and could be a year of solid economic performance. In our baseline scenario, we expect most of the supportive factors at work in 2025 to continue to play a role in 2026.

Avalanche struggles near $12 as Grayscale files updated form for ETF

Avalanche trades close to $12 by press time on Wednesday, extending the nearly 2% drop from the previous day. Grayscale filed an updated form to convert its Avalanche-focused Trust into an ETF with the US Securities and Exchange Commission.