- Silver attracts some dip-buying on Wednesday and spikes to a multi-day high.
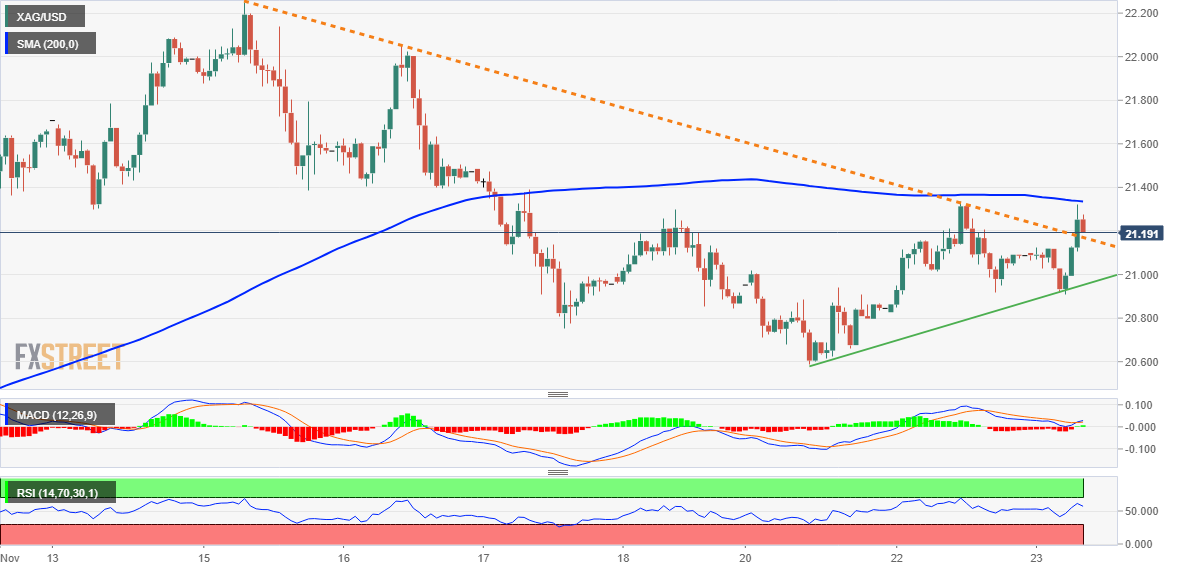
- The move confirms a breakout through a one-week-old descending trend line.
- A sustained break below the $21.00 mark is needed to negate the positive bias.
Silver reverses an intraday dip to sub-$21.00 levels and surges to a four-day high during the early European session on Wednesday. The white metal is currently trading around the $21.25-$21.30 region, up over 0.80% for the day, with bulls now awaiting a sustained move beyond the 200-hour SMA before placing fresh bets.
From a technical perspective, the momentum confirms a breakout through a one-week-old descending trend-line resistance. Meanwhile, oscillators on the daily chart are holding in the bullish territory and have just started gaining positive traction on hourly charts. This, in turn, supports prospects for an extension of the recovery from a nearly two-week low, around the $20.60-$20.55 area touched on Monday.
Some follow-through buying beyond the $21.35 region (200-hour SMA) will reaffirm the constructive outlook and lift the XAG/USD towards the $21.75-$21.80 resistance zone. This is followed by the $22.00 mark and over a five-month high, around the $22.25 area, which if cleared will set the stage for a move towards the $22.50-$22.60 supply zone. Spot prices could eventually reclaim the $23.00 round figure.
On the flip side, the $21.00-$20.90 area might continue to protect the immediate downside. The said support represents an ascending trend-line extending from the weekly low touched on Monday. A convincing break below will negate the positive set-up and shift the near-term bias in favour of bearish traders. The XAG/USD might then slide to the $20.60-$20.55 area (weekly low) and the $20.00 psychological mark.
Silver 1-hour chart
Key levels to watch
Information on these pages contains forward-looking statements that involve risks and uncertainties. Markets and instruments profiled on this page are for informational purposes only and should not in any way come across as a recommendation to buy or sell in these assets. You should do your own thorough research before making any investment decisions. FXStreet does not in any way guarantee that this information is free from mistakes, errors, or material misstatements. It also does not guarantee that this information is of a timely nature. Investing in Open Markets involves a great deal of risk, including the loss of all or a portion of your investment, as well as emotional distress. All risks, losses and costs associated with investing, including total loss of principal, are your responsibility. The views and opinions expressed in this article are those of the authors and do not necessarily reflect the official policy or position of FXStreet nor its advertisers. The author will not be held responsible for information that is found at the end of links posted on this page.
If not otherwise explicitly mentioned in the body of the article, at the time of writing, the author has no position in any stock mentioned in this article and no business relationship with any company mentioned. The author has not received compensation for writing this article, other than from FXStreet.
FXStreet and the author do not provide personalized recommendations. The author makes no representations as to the accuracy, completeness, or suitability of this information. FXStreet and the author will not be liable for any errors, omissions or any losses, injuries or damages arising from this information and its display or use. Errors and omissions excepted.
The author and FXStreet are not registered investment advisors and nothing in this article is intended to be investment advice.
Recommended content
Editors’ Picks
EUR/USD loses traction, retreats below 1.0600

EUR/USD lost its recovery momentum and declined below 1.0600 in the American session on Friday, erasing a portion of its daily gains in the process. Nevertheless, the risk-positive market atmosphere after PCE inflation data helps the pair limit its losses.
GBP/USD turns negative on the day below 1.2200

GBP/USD reversed its direction and slumped below 1.2200 in the American session on Friday after rising above 1.2270 earlier in the day. Position readjustments and profit-taking on the last trading day of the quarter seems to be weighing on Pound Sterling.
Gold reverses direction, drops below $1,860

Following a steady rebound toward $1,880 on Friday, Gold price made a sharp U-turn and turned negative on the day near $1,860. Although the 10-year US T-bond yield is down more than 1%, XAU/USD struggles to find demand on the last day of Q3.
Polkadot Price Forecast: DOT reversal seems inevitable after 92% correction from all-time high

Polkadot price, in nearly two years, has shed 92.91% from its all-time high of $55.09. The massive downswing in DOT has pushed it down to levels that were last seen in October 2020. Hence, the chances of this altcoin forming a bottom and rallying are high.
Earnings beat triggers Nike to spike 9%

Nike (NKE) stock has surged over 9% in Friday’s premarket, climbing above $98 per share, following late Thursday’s fiscal first-quarter earnings release. Nike beat pessimistic earnings expectations by more than 23% and hiked its dividend by 9%.