Silver Price Analysis: XAG/USD bulls have the upper hand above $25.00, over one-week top


  • Silver gains positive traction for the third straight day and climbs to over a one-week high.
  • Mixed oscillators on the daily chart warrant some caution for aggressive bullish traders.
  • Weakness below the $25.00 mark is more likely to get bought into and remain limited.

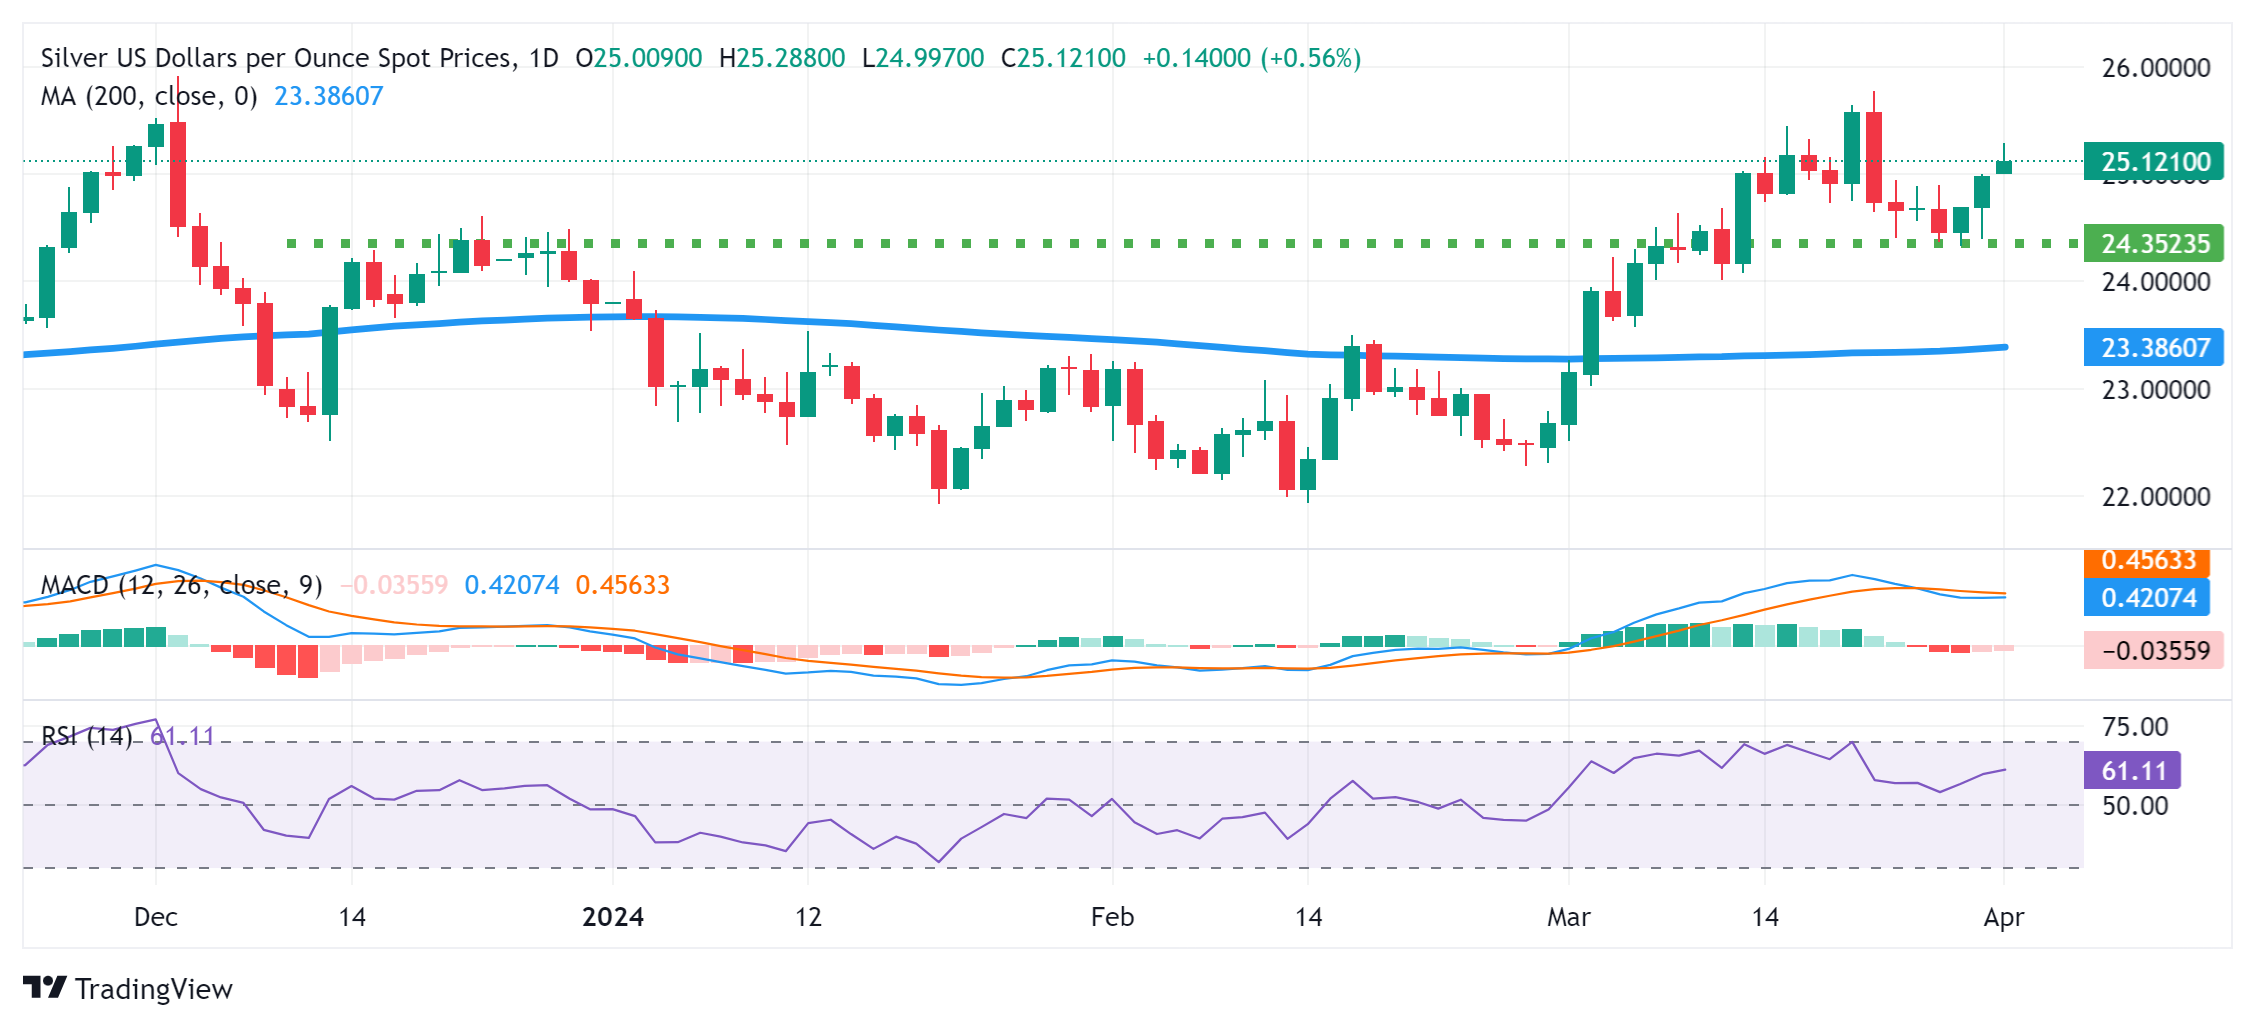
Silver (XAG/USD) builds on last week's bounce from the $24.35 resistance-turned-support zone and gains positive traction for the third successive day on Monday. The white metal sticks to its intraday gains through the first half of the European session and currently trades around the $25.15 region, just below a more than one-week top touched earlier today.

Meanwhile, mixed technical indicators on the daily chart warrant some caution for bullish traders. Hence, any subsequent move up is more likely to confront stiff resistance near the $25.65-$25.75 region, or the YTD peak touched in March. This is closely followed by the December 2023 swing high – levels just ahead of the $26.00 round figure. A sustained strength beyond the said handle should allow the XAG/USD to resume its recent strong uptrend witnessed since late February.

On the flip side, weakness back below the $25.00 psychological mark is likely to attract fresh buyers near the $24.65 region. This should help limit the downside for the XAG/USD near the aforementioned resistance-turned-support, around the $24.35 zone. The latter should act as a key pivotal point, which if broken decisively might shift the bias in favour of bearish traders and drag the white metal to the next relevant support near the $24.15-$24.10 region en route to the $24.00 mark.

Some follow-through selling would make the XAG/SUD vulnerable to accelerate the downward trajectory further towards the 200-day Simple Moving Average (SMA), currently pegged around the $23.35-$23.30 region.

Silver daily chart

fxsoriginal

XAG/USD

Overview
Today last price 25.12
Today Daily Change 0.14
Today Daily Change % 0.56
Today daily open 24.98
 
Trends
Daily SMA20 24.55
Daily SMA50 23.44
Daily SMA100 23.55
Daily SMA200 23.37
 
Levels
Previous Daily High 25
Previous Daily Low 24.39
Previous Weekly High 25
Previous Weekly Low 24.33
Previous Monthly High 25.77
Previous Monthly Low 22.51
Daily Fibonacci 38.2% 24.77
Daily Fibonacci 61.8% 24.63
Daily Pivot Point S1 24.58
Daily Pivot Point S2 24.18
Daily Pivot Point S3 23.97
Daily Pivot Point R1 25.19
Daily Pivot Point R2 25.4
Daily Pivot Point R3 25.8


Share: Feed news

Information on these pages contains forward-looking statements that involve risks and uncertainties. Markets and instruments profiled on this page are for informational purposes only and should not in any way come across as a recommendation to buy or sell in these assets. You should do your own thorough research before making any investment decisions. FXStreet does not in any way guarantee that this information is free from mistakes, errors, or material misstatements. It also does not guarantee that this information is of a timely nature. Investing in Open Markets involves a great deal of risk, including the loss of all or a portion of your investment, as well as emotional distress. All risks, losses and costs associated with investing, including total loss of principal, are your responsibility. The views and opinions expressed in this article are those of the authors and do not necessarily reflect the official policy or position of FXStreet nor its advertisers. The author will not be held responsible for information that is found at the end of links posted on this page.

If not otherwise explicitly mentioned in the body of the article, at the time of writing, the author has no position in any stock mentioned in this article and no business relationship with any company mentioned. The author has not received compensation for writing this article, other than from FXStreet.

FXStreet and the author do not provide personalized recommendations. The author makes no representations as to the accuracy, completeness, or suitability of this information. FXStreet and the author will not be liable for any errors, omissions or any losses, injuries or damages arising from this information and its display or use. Errors and omissions excepted.

The author and FXStreet are not registered investment advisors and nothing in this article is intended to be investment advice.

Recommended content


Recommended content

Editors’ Picks

EUR/USD holds higher ground above 1.1250

EUR/USD holds higher ground above 1.1250

EUR/USD recaptures 1.1250 in the European session on Tuesday, extending the previous gains. Renewed US Dollar weakness on fiscal and economic concerns amid US tariffs uncertainty underpins the pair. Speeches from ECB and Fed policymakers eyed amid a data-light calendar. 

GBP/USD defends gains above 1.3350 despite weak US Dollar

GBP/USD defends gains above 1.3350 despite weak US Dollar

GBP/USD sheds some ground while above 1.3350 in European trading on Tuesday. The pair fails to benefit from a fresh bout of US Dollar as markets remain cautious amid trade uncertainty and ahead of global PMI data due later this week. Fedspeak is next in focus. 

Gold price sticks to intraday losses amid positive risk tone; holds above $3,200

Gold price sticks to intraday losses amid positive risk tone; holds above $3,200

Gold price maintains its offered tone through the Asian session on Tuesday though it manages to hold above the $3,200 round figure. Against the backdrop of rising trade optimism, hopes for a Russia-Ukraine ceasefire remain supportive of a positive risk tone.

Solana set for a consensus switch with the introduction of Alpenglow

Solana set for a consensus switch with the introduction of Alpenglow

Solana (SOL) showed signs of recovery in the American trading session on Monday following the introduction of a new consensus protocol, Alpenglow, which would replace the network's current Proof-of-History and TowerBFT mechanisms. 

China April slowdown shows the impact of economic uncertainty

China April slowdown shows the impact of economic uncertainty

Trade war uncertainty is denting Chinese confidence, resulting in slower economic activity in April. Retail sales and fixed-asset investment both underperformed forecasts amid heightened caution. Yet the impact on manufacturing was less than feared.

The Best brokers to trade EUR/USD

The Best brokers to trade EUR/USD

SPONSORED Discover the top brokers for trading EUR/USD in 2025. Our list features brokers with competitive spreads, fast execution, and powerful platforms. Whether you're a beginner or an expert, find the right partner to navigate the dynamic Forex market.

Forex MAJORS

Cryptocurrencies

Signatures

Best Brokers of 2025