|

Silver Price Analysis: XAG/USD bulls await Russian actions above $24.00

  • Silver picks up bids to refresh intraday high, pares latest losses.
  • Markets keens await Russia’s next move, yields, S&P 500 Futures print mild losses.
  • US data, Fedspeak may also entertain silver traders, bulls have an upper hand until the war is over.

Silver (XAG/USD) takes the bids around $24.40 to renew the intraday top during Friday’s Asian session.

The bright metal rallied to the highest since August 2021 before reversing from $25.62. The pullback was fierce enough to print a negative close of the commodity even as market sentiment remains sour with eyes on the Russia-Ukraine war.

Global leaders criticize Russia’s invasion of Ukraine and showed readiness to levy more sanctions on Moscow, also help Ukraine with military power if needed. Even so, President Vladimir Putin’s forces rose past Chernobyl and Ukraine President Zelenskyy signed a decree for general mobilization.

On the positive side were comments from Russia, like “Moscow is willing to negotiate the terms of Ukraine's surrender,” to trigger the late Thursday’s pullback. Additionally, chatters that Ukraine President Zelenskyy said they need to discuss ceasefire with Russia also favored risk sentiment during the late Thursday.

That said, Wall Street closed with mild gains after the initial plunge whereas the US 10-year Treasury yields closed more or less at the same level the previous day, after marking a volatile day. However, S&P 500 Futures drop 0.20% and the US Treasury yields remain pressured around 1.96% by the press time.

Markets currently await updates from Ukraine as CNN conveyed that the Russian military is up for bombardment on Kyiv.

Other than the geopolitical news, US Core PCE Inflation data and Durable Goods Orders may join Fedspeak to provide immediate directions to silver traders.

Technical analysis

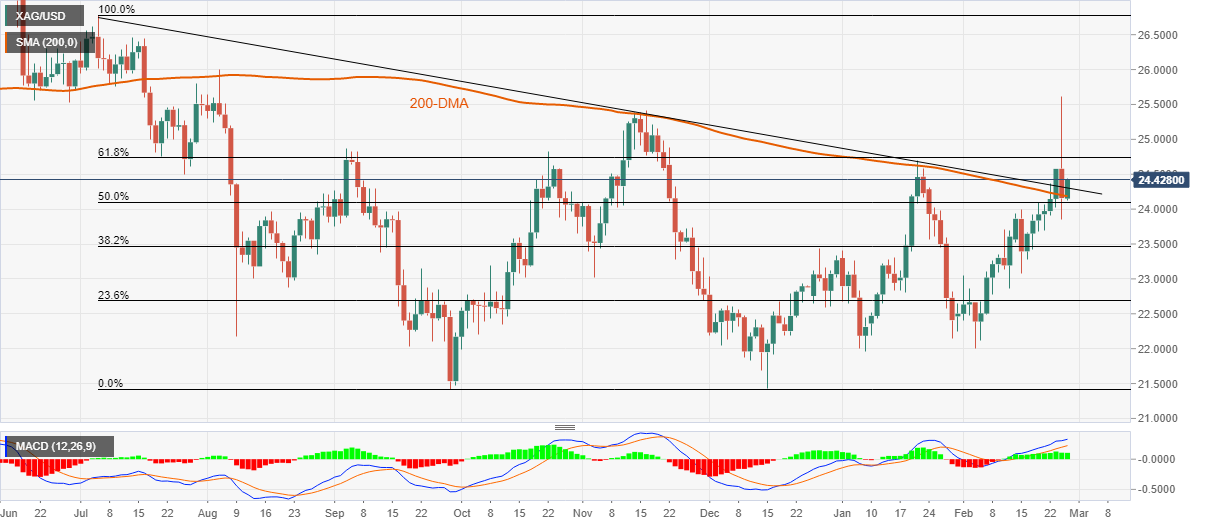
Silver bounces off the 200-DMA level of $24.18 to mark another battle with a downward sloping trend line from July 2021, near $24.35-40.

A clear break of $24.40 will direct XAG/USD towards the 61.8% Fibonacci retracement (Fibo.) of July-September downside, around $24.75.

However, tops marked in November and the latest swing high, respectively around $25.40 and $25.65, will challenge the silver buyers afterward.

Meanwhile, the 50% Fibo. level surrounding $24.10 precedes the $24.00 threshold to restrict short-term XAG/USD downside.

Silver: Daily chart

Trend: Further upside expected

Additional important levels

Overview
Today last price24.37
Today Daily Change0.21
Today Daily Change %0.87
Today daily open24.16
 
Trends
Daily SMA2023.35
Daily SMA5023.18
Daily SMA10023.36
Daily SMA20024.2
 
Levels
Previous Daily High25.62
Previous Daily Low23.84
Previous Weekly High24.09
Previous Weekly Low23.08
Previous Monthly High24.7
Previous Monthly Low21.96
Daily Fibonacci 38.2%24.52
Daily Fibonacci 61.8%24.94
Daily Pivot Point S123.46
Daily Pivot Point S222.77
Daily Pivot Point S321.69
Daily Pivot Point R125.24
Daily Pivot Point R226.32
Daily Pivot Point R327.01

Author

Anil Panchal

Anil Panchal

FXStreet

Anil Panchal has nearly 15 years of experience in tracking financial markets. With a keen interest in macroeconomics, Anil aptly tracks global news/updates and stays well-informed about the global financial moves and their implications.

More from Anil Panchal
Share:

Editor's Picks

AUD/USD eyes 0.7150 barrier nine-day EMA

AUD/USD inches higher after registering modest losses in the previous day, trading around 0.7130 during the Asian hours. The technical analysis of the daily chart indicates that the pair is moving sideways within the rectangle pattern, suggesting a consolidation as neither the bulls nor the bears have enough momentum to take control of the market.

USD/JPY trades below 160.00 intervention threshold; bullish bias intact

The USD/JPY pair attracts some sellers during the Asian session amid fears that authorities will step in again to prop up the Japanese Yen. Furthermore, the Israel-Lebanon truce prompts some profit-taking around the US Dollar and exerts downward pressure on the currency pair.

Gold puts its 200-day SMA to the test near $4,420

Gold keeps the bullish stance in place in the latter part of Thursday’s session, although a convincing break above the key $4,500 mark per troy ounce still remains elusive. The precious metal’s advance comes amid the resurgence of some selling interest around the Greenback, improving risk sentiment, and declining US Treasury yields across the board.

Bitcoin’s massive storm is back: Why the sell-off is far from over

Bitcoin price action over the last few weeks has felt less like a normal, healthy correction and more like a slow grinding crash that continues to wreak havoc on holdings and trading accounts. And everything suggests that the dramatic crash isn’t over.

Nonfarm payrolls: Testing the limits of Fed policy patience

The upcoming nonfarm payrolls report for May will provide the final update on the US labor market before Kevin Warsh attends his first policy meeting as the new Fed Chair later this month.

Recession on paper: What really moves the Canadian Loonie now?

Statistics Canada handed the headline writers a gift and the analysts a headache. Real GDP shrank 0.1% on an annualized basis in the first quarter, and with the fourth quarter of 2025 revised down to a 1.0% contraction, that is two negative quarters in a row, the textbook definition of a technical recession and Canada's first since the pandemic.