|

Silver Price Analysis: XAG/USD bears await sustained break below 61.8% Fibo. level

  • Silver comes under some renewed selling pressure and snaps a two-day winning streak.
  • The technical setup favours bearish traders and supports prospects for additional losses.
  • Slightly oversold oscillators on the daily chart warrant caution for bears.

Silver struggles to capitalize on this week's modest recovery gains recorded over the past two days and meets with a fresh supply on Thursday. The white metal remains depressed through the mid-European session and is currently placed near the lower end of its daily trading range, around the $20.80 region.

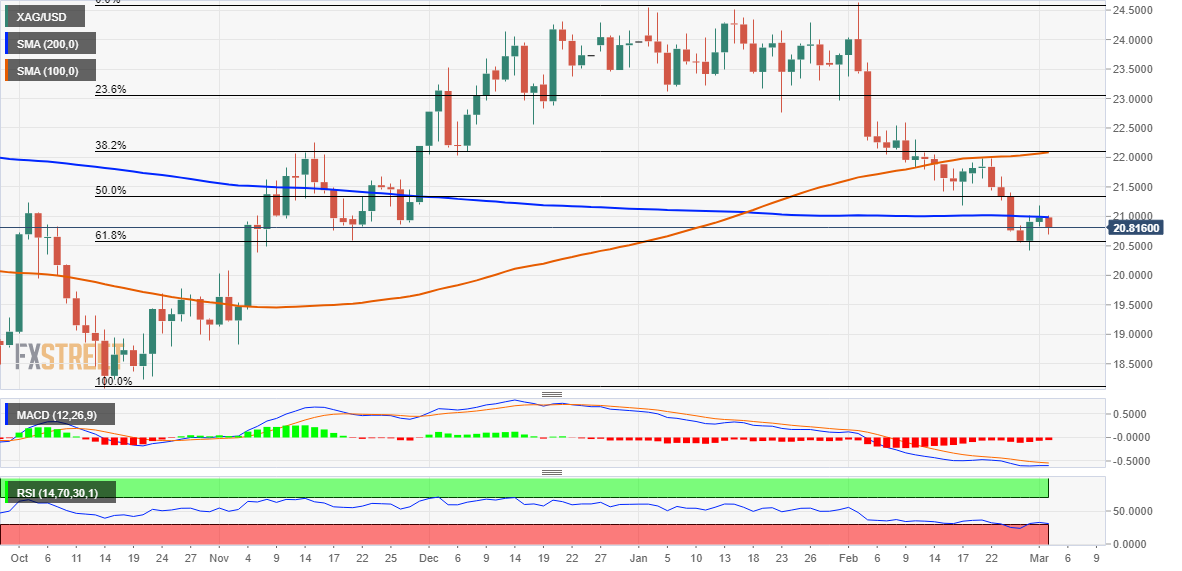
From a technical perspective, the XAG/USD, so far, has managed to hold its neck above the 61.8% Fibonacci retracement level of the recent rally from the October 2022 low. The said support is pegged near the $20.60 area, which is followed by the YTD low, around the $20.40 region touched earlier this week. A convincing break below the latter will be seen as a fresh trigger for bears and set the stage for an extension of the recent slide from the $24.65 zone, or a multi-month top set in February.

Oscillators on the daily chart are hovering near the oversold territory, with the RSI just recovering out of oversold. This makes it prudent to wait for some near-term consolidation or a modest rebound before placing fresh bearish bets. Nevertheless, the lack of any meaningful buying suggests that the path of least resistance for the XAG/USD is to the downside. Hence, some follow-through weakness to the $20.00 psychological mark, en route to the next relevant support near the $19.75-$19.70 region, looks like a distinct possibility.

On the flip side, attempted recovery back above the $21.00 round figure now seems to confront some hurdle near the overnight swing high, around the $21.15-$21.20 area, ahead of the $21.35 region (50% Fibo. level). Any subsequent strength could be seen as a selling opportunity and runs the risk of fizzling out near the $22.00 confluence support breakpoint. The said handle comprises 100-day Simple Moving Average (SMA) and 38.2% Fibo. level, which if cleared could negate the bearish bias.

The XAG/USD could then witness a short-covering rally towards the $22.55-$22.60 supply zone, above which bulls might aim to reclaim the $23.00 round-figure mark, which coincides with the 23.6% Fibo. level.

Silver daily chart

fxsoriginal

Key levels to watch

XAG/USD

Overview
Today last price20.83
Today Daily Change-0.15
Today Daily Change %-0.71
Today daily open20.98
 
Trends
Daily SMA2021.76
Daily SMA5022.97
Daily SMA10022.07
Daily SMA20020.99
 
Levels
Previous Daily High21.18
Previous Daily Low20.84
Previous Weekly High21.98
Previous Weekly Low20.74
Previous Monthly High24.64
Previous Monthly Low20.42
Daily Fibonacci 38.2%21.05
Daily Fibonacci 61.8%20.97
Daily Pivot Point S120.82
Daily Pivot Point S220.65
Daily Pivot Point S320.47
Daily Pivot Point R121.16
Daily Pivot Point R221.35
Daily Pivot Point R321.51

Author

Haresh Menghani

Haresh Menghani is a detail-oriented professional with 10+ years of extensive experience in analysing the global financial markets.

More from Haresh Menghani
Share:

Editor's Picks

GBP/USD bounces off lows, back above 1.3200

After bottoming out near 1.3160, GBP/USD manages to regain a bit of shine and reclaim the 1.3200 mark and beyond at the end of the week. Stronger-than-expected UK Retail Sales data seem to be helping the British Pound limit its losses, while the chaotic UK political environment keeps the bulls at bay for now.

EUR/USD looks consolidative around 1.1460

EUR/USD stages a modest rebound after slipping to a three-month low below 1.1420 at the end of the week. That said, the pair now looks to consolidate humble gains just above 1.1460 despite growing uncertainty surrounding the next round of US-Iran negotiations, which keeps the US Dollar’s downside contained.

Gold slips back to six-day lows, targets $4,100

Gold retreats for the third consecutive day on Friday, eroding gains seen in the first half of the week and approaching the key $4,100 mark per troy ounce. Indeed, the precious metal continues to face headwinds from the Fed's hawkish stance and renewed uncertainty surrounding the next round of US-Iran negotiations.

Breaking: Iran closes the Strait of Hormuz amid ceasefire deal violation
Iran says it is closing the Strait of Hormuz after accusing the United States (US) and Israel of violating the ceasefire. According to Iran, the decision came over the continued Israeli strikes in Lebanon. The Iranian Revolutionary Guard Corps Navy issued a warning to all vessels: "Do not approach the Strait of Hormuz; otherwise, your security will be jeopardized."
The Iran war didn't break the US economy, but what happens next?

Nearly four months after the start of the Iran war, the US economy remains remarkably resilient. While the conflict initially triggered a severe disruption to global energy markets and a sharp rise in Oil prices, recent diplomatic progress between Washington and Tehran has eased concerns about a prolonged supply shock.

Regime change: Inside Kevin Warsh's first move to make the Fed unreadable on purpose

The rate did not move. That was the least interesting thing about Kevin Warsh's first meeting in charge of the Fed. The FOMC held its benchmark at 3.50%-3.75% for the fourth straight meeting, exactly as priced, and then the new chair used his first press conference to dismantle the machinery the market has leaned on for a decade.