|

Silver Price Analysis: XAG/USD battles $24.00 hurdle amid impending bull cross

  • Silver grinds higher around three-week top on looming bullish moving average cross.
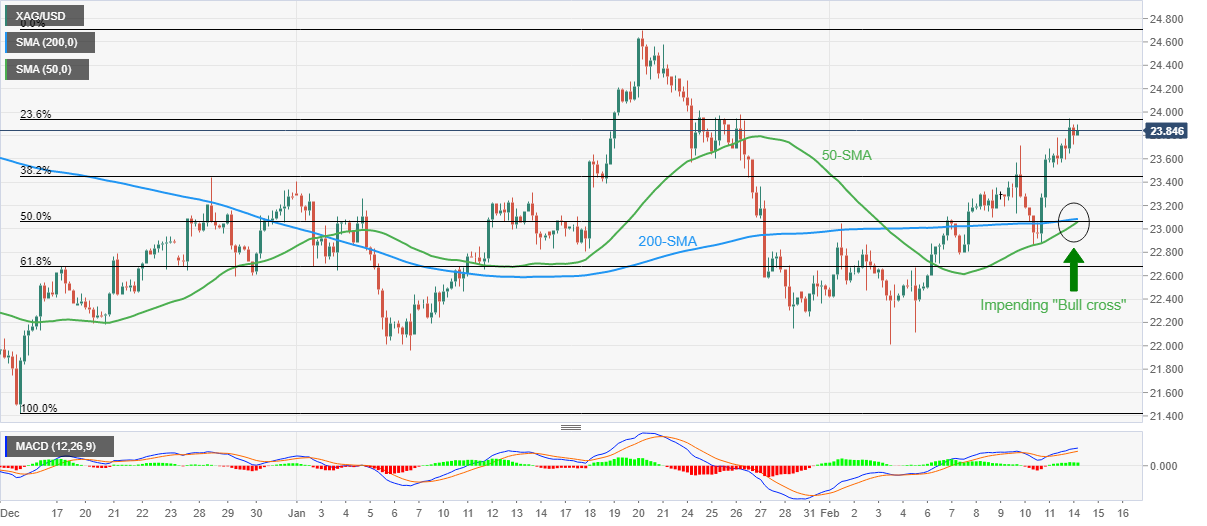
  • Upbeat MACD signals keep buyers hopeful, 23.6% Fibonacci retracement guards immediate upside.
  • Sellers remain unconvinced beyond $23.00, January’s peak lure bulls.

Silver (XAG/USD) buyers take a breather around three-week high, taking rounds to $23.85-90 during the initial Asian session on Tuesday.

In doing so, the bright metal bulls attack 23.6% Fibonacci retracement (Fibo.) of December-January upside.

That said, the 50-SMA stays ready to pierce the 200-SMA, suggesting a bull cross, amid price-positive signals from the MACD.

Hence, XAG/USD buyers are waiting for the $24.00 breakout to excel further, which in turn will highlight the previous month’s top near $24.70.

Following that, the $25.00 threshold and November 2021 peak surrounding $25.40 will be in focus.

Alternatively, pullback moves may aim for the 38.2% Fibo. level near $23.45 but a convergence of the 50-SMA and 200-SMA, as well as the 50% Fibonacci retracement, highlights $23.05, as the key support level.

Also acting as a downside filter is the $23.00 round figure, a break of which will welcome XAG/USD sellers targeting a monthly low of $22.00.

Silver: Four-hour chart

Trend: Further upside expected

Additional important levels

Overview
Today last price23.85
Today Daily Change0.24
Today Daily Change %1.02%
Today daily open23.61
 
Trends
Daily SMA2023.24
Daily SMA5022.87
Daily SMA10023.22
Daily SMA20024.36
 
Levels
Previous Daily High23.69
Previous Daily Low22.86
Previous Weekly High23.72
Previous Weekly Low22.49
Previous Monthly High24.7
Previous Monthly Low21.96
Daily Fibonacci 38.2%23.37
Daily Fibonacci 61.8%23.18
Daily Pivot Point S123.08
Daily Pivot Point S222.56
Daily Pivot Point S322.25
Daily Pivot Point R123.91
Daily Pivot Point R224.21
Daily Pivot Point R324.74

Author

Anil Panchal

Anil Panchal

FXStreet

Anil Panchal has nearly 15 years of experience in tracking financial markets. With a keen interest in macroeconomics, Anil aptly tracks global news/updates and stays well-informed about the global financial moves and their implications.

More from Anil Panchal
Share:

Editor's Picks

AUD/USD eyes 0.7150 barrier nine-day EMA

AUD/USD inches higher after registering modest losses in the previous day, trading around 0.7130 during the Asian hours. The technical analysis of the daily chart indicates that the pair is moving sideways within the rectangle pattern, suggesting a consolidation as neither the bulls nor the bears have enough momentum to take control of the market.

USD/JPY trades below 160.00 intervention threshold; bullish bias intact

The USD/JPY pair attracts some sellers during the Asian session amid fears that authorities will step in again to prop up the Japanese Yen. Furthermore, the Israel-Lebanon truce prompts some profit-taking around the US Dollar and exerts downward pressure on the currency pair.

Gold extends rebound to $4,500 as US yields edge lower

Gold (XAU/USD) preserves its recovery momentum following Wednesday's slide and tests the $4,500 mark in the second half of the day on Thursday. While US-Iran uncertainty remains, easing tensions between Lebanon on Israel seems to be helping the market mood improve, causing the USD to lose strength alongside falling US T-bond yields and opening the door for a decisive rebound in XAU/USD.

Bitcoin’s massive storm is back: Why the sell-off is far from over

Bitcoin price action over the last few weeks has felt less like a normal, healthy correction and more like a slow grinding crash that continues to wreak havoc on holdings and trading accounts. And everything suggests that the dramatic crash isn’t over.

Nonfarm payrolls: Testing the limits of Fed policy patience

The upcoming nonfarm payrolls report for May will provide the final update on the US labor market before Kevin Warsh attends his first policy meeting as the new Fed Chair later this month.

Recession on paper: What really moves the Canadian Loonie now?

Statistics Canada handed the headline writers a gift and the analysts a headache. Real GDP shrank 0.1% on an annualized basis in the first quarter, and with the fourth quarter of 2025 revised down to a 1.0% contraction, that is two negative quarters in a row, the textbook definition of a technical recession and Canada's first since the pandemic.