|

Silver Price Analysis: Rising wedge confirmation lures XAG/USD bears towards $22.00

  • Silver price prints three-day losing streak, confirms two-week-old bearish chart pattern.
  • Bearish MACD signals add strength to downside bias for XAG/USD price.
  • 200-SMA, $21.30 can act as buffers during theoretical targeting surrounding $17.10.
  • Silver buyers need validation from golden Fibonacci ratio.

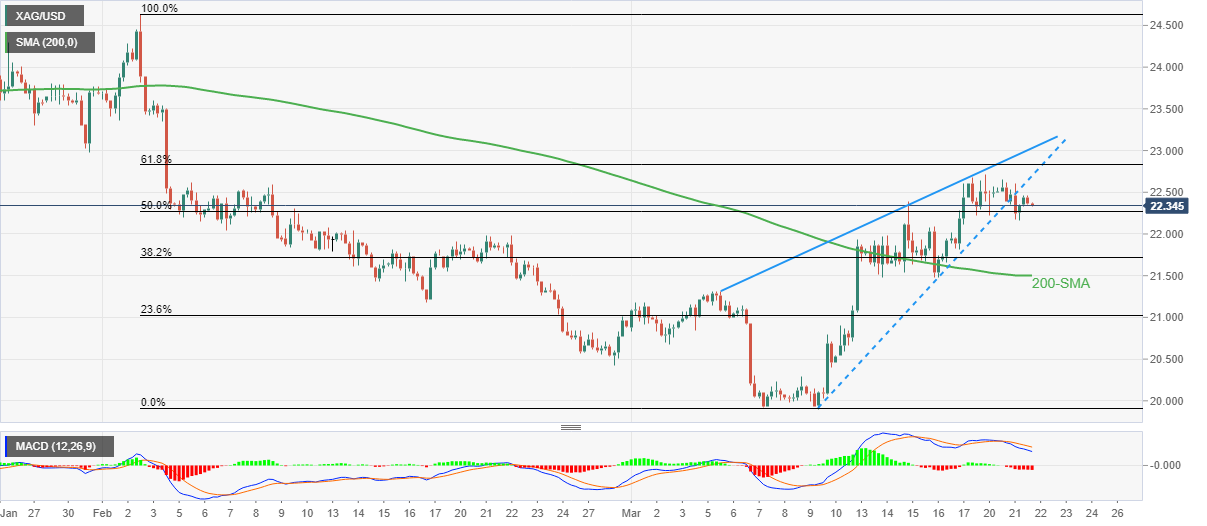
Silver price (XAG/USD) remains depressed around $22.30, making rounds to intraday low during a three-day downtrend heading into Wednesday’s European session.

The bright metal’s latest fall could be linked to the confirmation of a two-week-old rising wedge bearish chart pattern, as well as the bearish MACD signals.

That said, the quote is well-set for visiting the 200-Simple Moving Average (SMA) support level surrounding $21.50 before declining towards the theoretical target of $17.10.

It’s worth noting that the late February swing high and the current monthly low, respectively around $22.00 and $19.90, can act as additional downside filters to watch during the XAG/USD’s further downside.

On the flip side, the stated wedge’s lower line acts as an immediate resistance for the Silver price of around $22.70.

Following that, the 61.8% Fibonacci retracement of the metal’s February-March downside, also known as the “golden Fibonacci ratio”, could challenge the Silver buyers near $22.85.

In a case where the XAG/USD remains firmer past $22.85, the aforementioned bearish chart pattern’s top line joins the late January swing low to highlight the $23.00 as a tough nut to crack for the Silver bulls before giving them control.

Silver price: Four-hour chart

Trend: Further downside expected

Additional important levels

Overview
Today last price22.35
Today Daily Change-0.05
Today Daily Change %-0.22%
Today daily open22.4
 
Trends
Daily SMA2021.23
Daily SMA5022.29
Daily SMA10022.38
Daily SMA20020.96
 
Levels
Previous Daily High22.65
Previous Daily Low22.16
Previous Weekly High22.61
Previous Weekly Low20.54
Previous Monthly High24.64
Previous Monthly Low20.42
Daily Fibonacci 38.2%22.34
Daily Fibonacci 61.8%22.46
Daily Pivot Point S122.15
Daily Pivot Point S221.91
Daily Pivot Point S321.66
Daily Pivot Point R122.64
Daily Pivot Point R222.89
Daily Pivot Point R323.14

Author

Anil Panchal

Anil Panchal

FXStreet

Anil Panchal has nearly 15 years of experience in tracking financial markets. With a keen interest in macroeconomics, Anil aptly tracks global news/updates and stays well-informed about the global financial moves and their implications.

More from Anil Panchal
Share:

Markets move fast. We move first.

Orange Juice Newsletter brings you expert driven insights - not headlines. Every day on your inbox.

By subscribing you agree to our Terms and conditions.

Editor's Picks

EUR/USD bounces toward 1.1750 as US Dollar loses strength

EUR/USD returned to the 1.1750 price zone in the American session on Friday, despite falling Wall Street, which indicates risk aversion. Trading conditions remain thin following the New Year holiday and ahead of the weekend, with the focus shifting to US employment and European data scheduled for next week.

GBP/USD nears 1.3500, holds within familiar levels

After testing 1.3400 on the last day of 2025, GBP/USD managed to stage a rebound. Nevertheless, the pair finds it difficult to gather momentum and trades with modest intraday gains at around 1.3490 as market participants remain in holiday mood.

Gold trims intraday gains, approaches $4,300

Gold retreated sharply from the $4,400  area and trades flat for the day in the $4,320 price zone. Choppy trading conditions exacerbated the intraday decline, although XAU/USD bearish case is out of the picture, considering growing expectations for a dovish Fed and persistent geopolitical tensions.

Cardano gains early New Year momentum, bulls target falling wedge breakout

Cardano kicks off the New Year on a positive note and is extending gains, trading above $0.36 at the time of writing on Friday. Improving on-chain and derivatives data point to growing bullish interest, while the technical outlook keeps an upside breakout in focus.

Economic outlook 2026-2027 in advanced countries: Solidity test

After a year marked by global economic resilience and ending on a note of optimism, 2026 looks promising and could be a year of solid economic performance. In our baseline scenario, we expect most of the supportive factors at work in 2025 to continue to play a role in 2026.

Crypto market outlook for 2026

Year 2025 was volatile, as crypto often is.  Among positive catalysts were favourable regulatory changes in the U.S., rise of Digital Asset Treasuries (DAT), adoption of AI and tokenization of Real-World-Assets (RWA).