Silver Price Analysis: Defending 21-SMA on 4H chart is critical for XAG/USD bulls
- Silver hovers within a symmetrical triangle on the 4H chart.
- XAG/USD awaits a range break, with odds for the upside higher.
- Bullish RSI and 21-SMA support keep the XAG buyers hopeful.

Silver (XAG/USD) has reclaimed the green territory after snapping back into losses on Monday.
Sellers continue to lurk above the $26 mark, keeping the support zone around $25.80/60 region exposed.
However, the rising 21-simple moving average (SMA) at $25.87 has every time come to the rescue of the XAG bulls.
Therefore, it's critical for the white metal that the 21-SMA support holds, in order to recapture the $26 threshold.
If the buying pressure intensifies around silver, we could see the $26 level likely to be taken out, as the triangle resistance could come into the picture at $26.15.
A four-hour candlestick closing above the latter is likely to validate a symmetrical triangle breakout, opening doors towards the $26.50 psychological level.
The Relative Strength Index (RSI) trades listless around 58.50 but above the central line. Thus, the odds of a potential upside remain higher.
Silver Price Chart: Four-hour
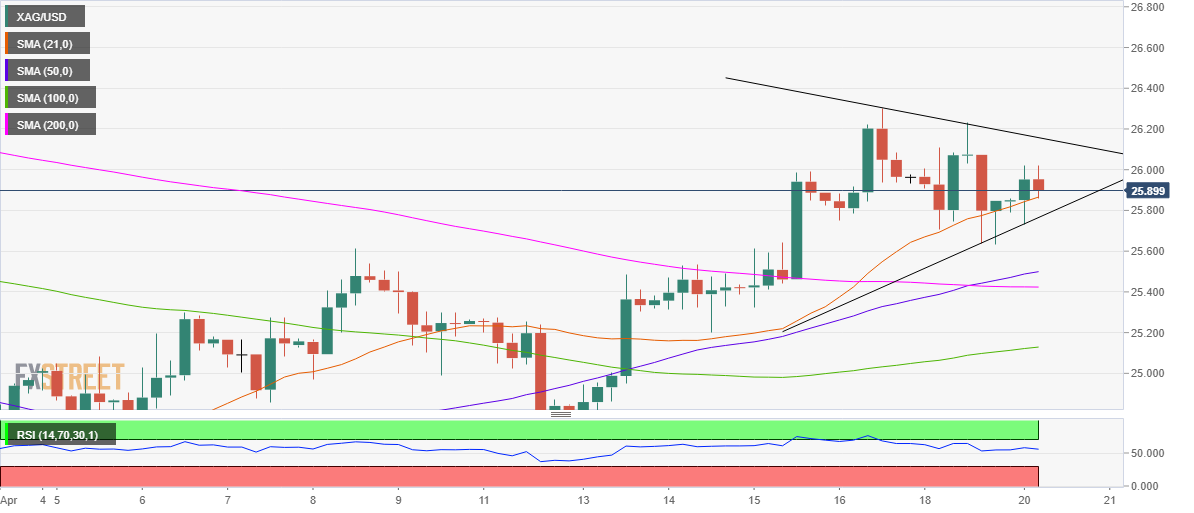
However, if the price closes the candlestick below the 21-SMA support, a breach of the triangle support remains inevitable.
The ascending 50-SMA support at $25.49 will be up for grabs.
Silver Additional levels
Author

Dhwani Mehta
FXStreet
Residing in Mumbai (India), Dhwani is a Senior Analyst and Manager of the Asian session at FXStreet. She has over 10 years of experience in analyzing and covering the global financial markets, with specialization in Forex and commodities markets.


